



Stay manual
Hours re-keyed every week, a month-end that breaks when one person is off, and numbers leadership never fully trusts.
The cost:
Hours lost every week
Last updated 24 July 2026
I've kept this short and plain. It explains what happens to your information when you use woollamanalytics.com or get in touch.
This site belongs to Douglas Woollam, trading as Woollam Analytics, based in Cork, Ireland. I'm the data controller for anything you share here, and you can reach me at douglaswoollam@gmail.com.
When you send an enquiry: the contact forms ask for your name, email and message; the services and AI forms also ask about your role, budget and timeline. I use this only to reply and to talk about working together. The lawful basis is taking steps at your request before a possible contract, plus my legitimate interest in answering enquiries. Submissions reach my inbox through FormSubmit.
When you browse: if you accept analytics, Google Analytics 4 records how the site is used: pages viewed, rough location (from your IP, which isn't stored), and device or browser type. Nothing runs until you accept, so the lawful basis is your consent.
No analytics cookies are set until you click Accept on the cookie banner. If you accept, Google Analytics sets these:
| Cookie | Purpose | Expires |
|---|---|---|
_ga | Tells returning visitors apart | 2 years |
_ga_H9MWXWGMXE | Keeps the Google Analytics session state | 2 years |
The site also stores a few things in your browser so it works properly: your theme choice, your cookie decision, and a daily message count. These stay on your device, aren't cookies, and don't track you. You can change or withdraw your choice any time from "Cookie settings" in the footer.
Google (Google Analytics) handles analytics, only with your consent. FormSubmit delivers your enquiry to my inbox. Both may process data outside the EU, including in the US, under Standard Contractual Clauses and the EU-US Data Privacy Framework.
Enquiry emails stay as long as I need them to help you and follow up, then I delete them. Analytics data is kept for up to 14 months in Google Analytics, then removed automatically.
You can ask to see, correct, delete, or limit how I use your data, object to how I use it, or get a copy to take elsewhere. Email me and I'll sort it. You can withdraw analytics consent whenever you like from Cookie settings.
Email douglaswoollam@gmail.com first. I'd rather put things right directly. You also have the right to complain to the Irish Data Protection Commission at dataprotection.ie.
For the first callers only, and only for a short while: a free 15-minute assessment. I find the single highest-value hour AI can give back to your week, and show you the tool that does it. No pitch, no obligation.
I’m a Data & AI Specialist and an MSc Bioinformatics & Computational Biology graduate (data science and machine learning where the “big data” is the human genome).
Currently at Apple, I manage a multi billion dollar portfolio of sales programs where I’ve been laser focused on creating business insights for executives across the entire EMIEA region.
I’ve relentlessly spent thousands of hours on Agentic AI & automation, developing scripts and data that drive decision making, save time and money. Example work is showcased across this site and GitHub.
Select a tool to filter the projects below.

Working across data engineering, analytics, and data science to turn complex EMEIA Business Sales data into automated, insight-rich solutions, building the pipelines and models behind regional dashboards, plus predictive models and advanced analyses for Account Executives and senior leadership tracking multi-billion-dollar sales programs.
Tools: Tableau · Snowflake SQL · Python (Pandas, Selenium, Playwright) · AI agents (Claude) · Microsoft Excel

Have a dataset, a dashboard, or a question? Send a note and I’ll get back to you.
Curious how a project runs? See how working together works.
A paid diagnostic scopes the work, a fixed-scope build ships it on your live data, and an optional retainer keeps it running. Senior delivery, fixed scope, no lock-in.
A paid, one-week audit that pinpoints where manual reporting or a fragile forecast is costing you, and exactly what to build.
Best for: a COO, operations or finance leader who suspects a manual report, a fragile forecast or a hand-run workflow is leaking time, money or trust, but hasn't quantified it.
Not included: the production build, live deployment or ongoing support. Those are the build and the retainer.
One production system your team trusts, built on your live data against a written spec and validated before handover. Three outcomes:
Trusted Executive Dashboard · Forecast / Reporting Rebuild · One Automated Workflow (with governance).
Not included: work outside the written spec (handled by change order) and ongoing maintenance (that's the retainer).
Your systems kept live, monitored and evolving, senior capacity without a full-time hire.
Best for: an organisation that wants its dashboards, forecasts and automations kept reliable and improving, without hiring a €55k+ salaried analyst.
Not included: large new builds beyond the capped block, which are scoped as fresh projects.
Not sure which fits? Book a discovery call and I'll tell you honestly whether I can help. Engagements start with a paid diagnostic and run into four and five figures for a build.Indicative "from" prices; each build is scoped and quoted from your diagnostic.
When reporting is held together by hand and approvals run on memory, leadership ends up deciding on numbers no one fully trusts. Here's how most teams cope:
Hours re-keyed every week, a month-end that breaks when one person is off, and numbers leadership never fully trusts.
A €55k+ salary, plus payroll and the effort of managing someone, when the work that actually needs a senior analyst only comes up a few days a month.
Decisions keep getting made on shaky numbers, risk compounds, and the manual work quietly scales with the business.
The job is always the same: take reporting that lives in someone's head or a fragile spreadsheet and turn it into a system people can trust.
Built an automated agent pipeline that checks each customer against the business's own rules and approves or rejects them, taking hours of manual review off the team every day while keeping a person in the loop.
| What's included | Forecast & Reporting Rebuildfrom €8,000 | Trusted Executive Dashboardfrom €8,000Most common | One Automated Workflowfrom €12,000 |
|---|---|---|---|
| A live dashboard leadership relies on | |||
| A fragile forecast or manual report rebuilt and made auditable | |||
| A repetitive manual workflow automated with human oversight | |||
| Governance layer: human-in-the-loop, audit trail, rollback | |||
| Built and validated on your live data | |||
| Scoped from a paid diagnostic, with written acceptance criteria | |||
| A UAT-and-hardening phase before handover | |||
| Runbooks, monitoring and alerting | |||
| Source in your own repository, no lock-in | |||
| A defined post-handover support window |
Modular by design. Start with whichever phase fits, there's no obligation to take all three.
Find the real problems.
Build and validate the system.
Keep it improving with ongoing support.
Every stage of working together, so you know what to expect before you commit.
We start with a call to go through your objectives, where your data actually lives, and the numbers you want to track: revenue, deals, pipeline stages, team performance. Everything lines up before I build anything.
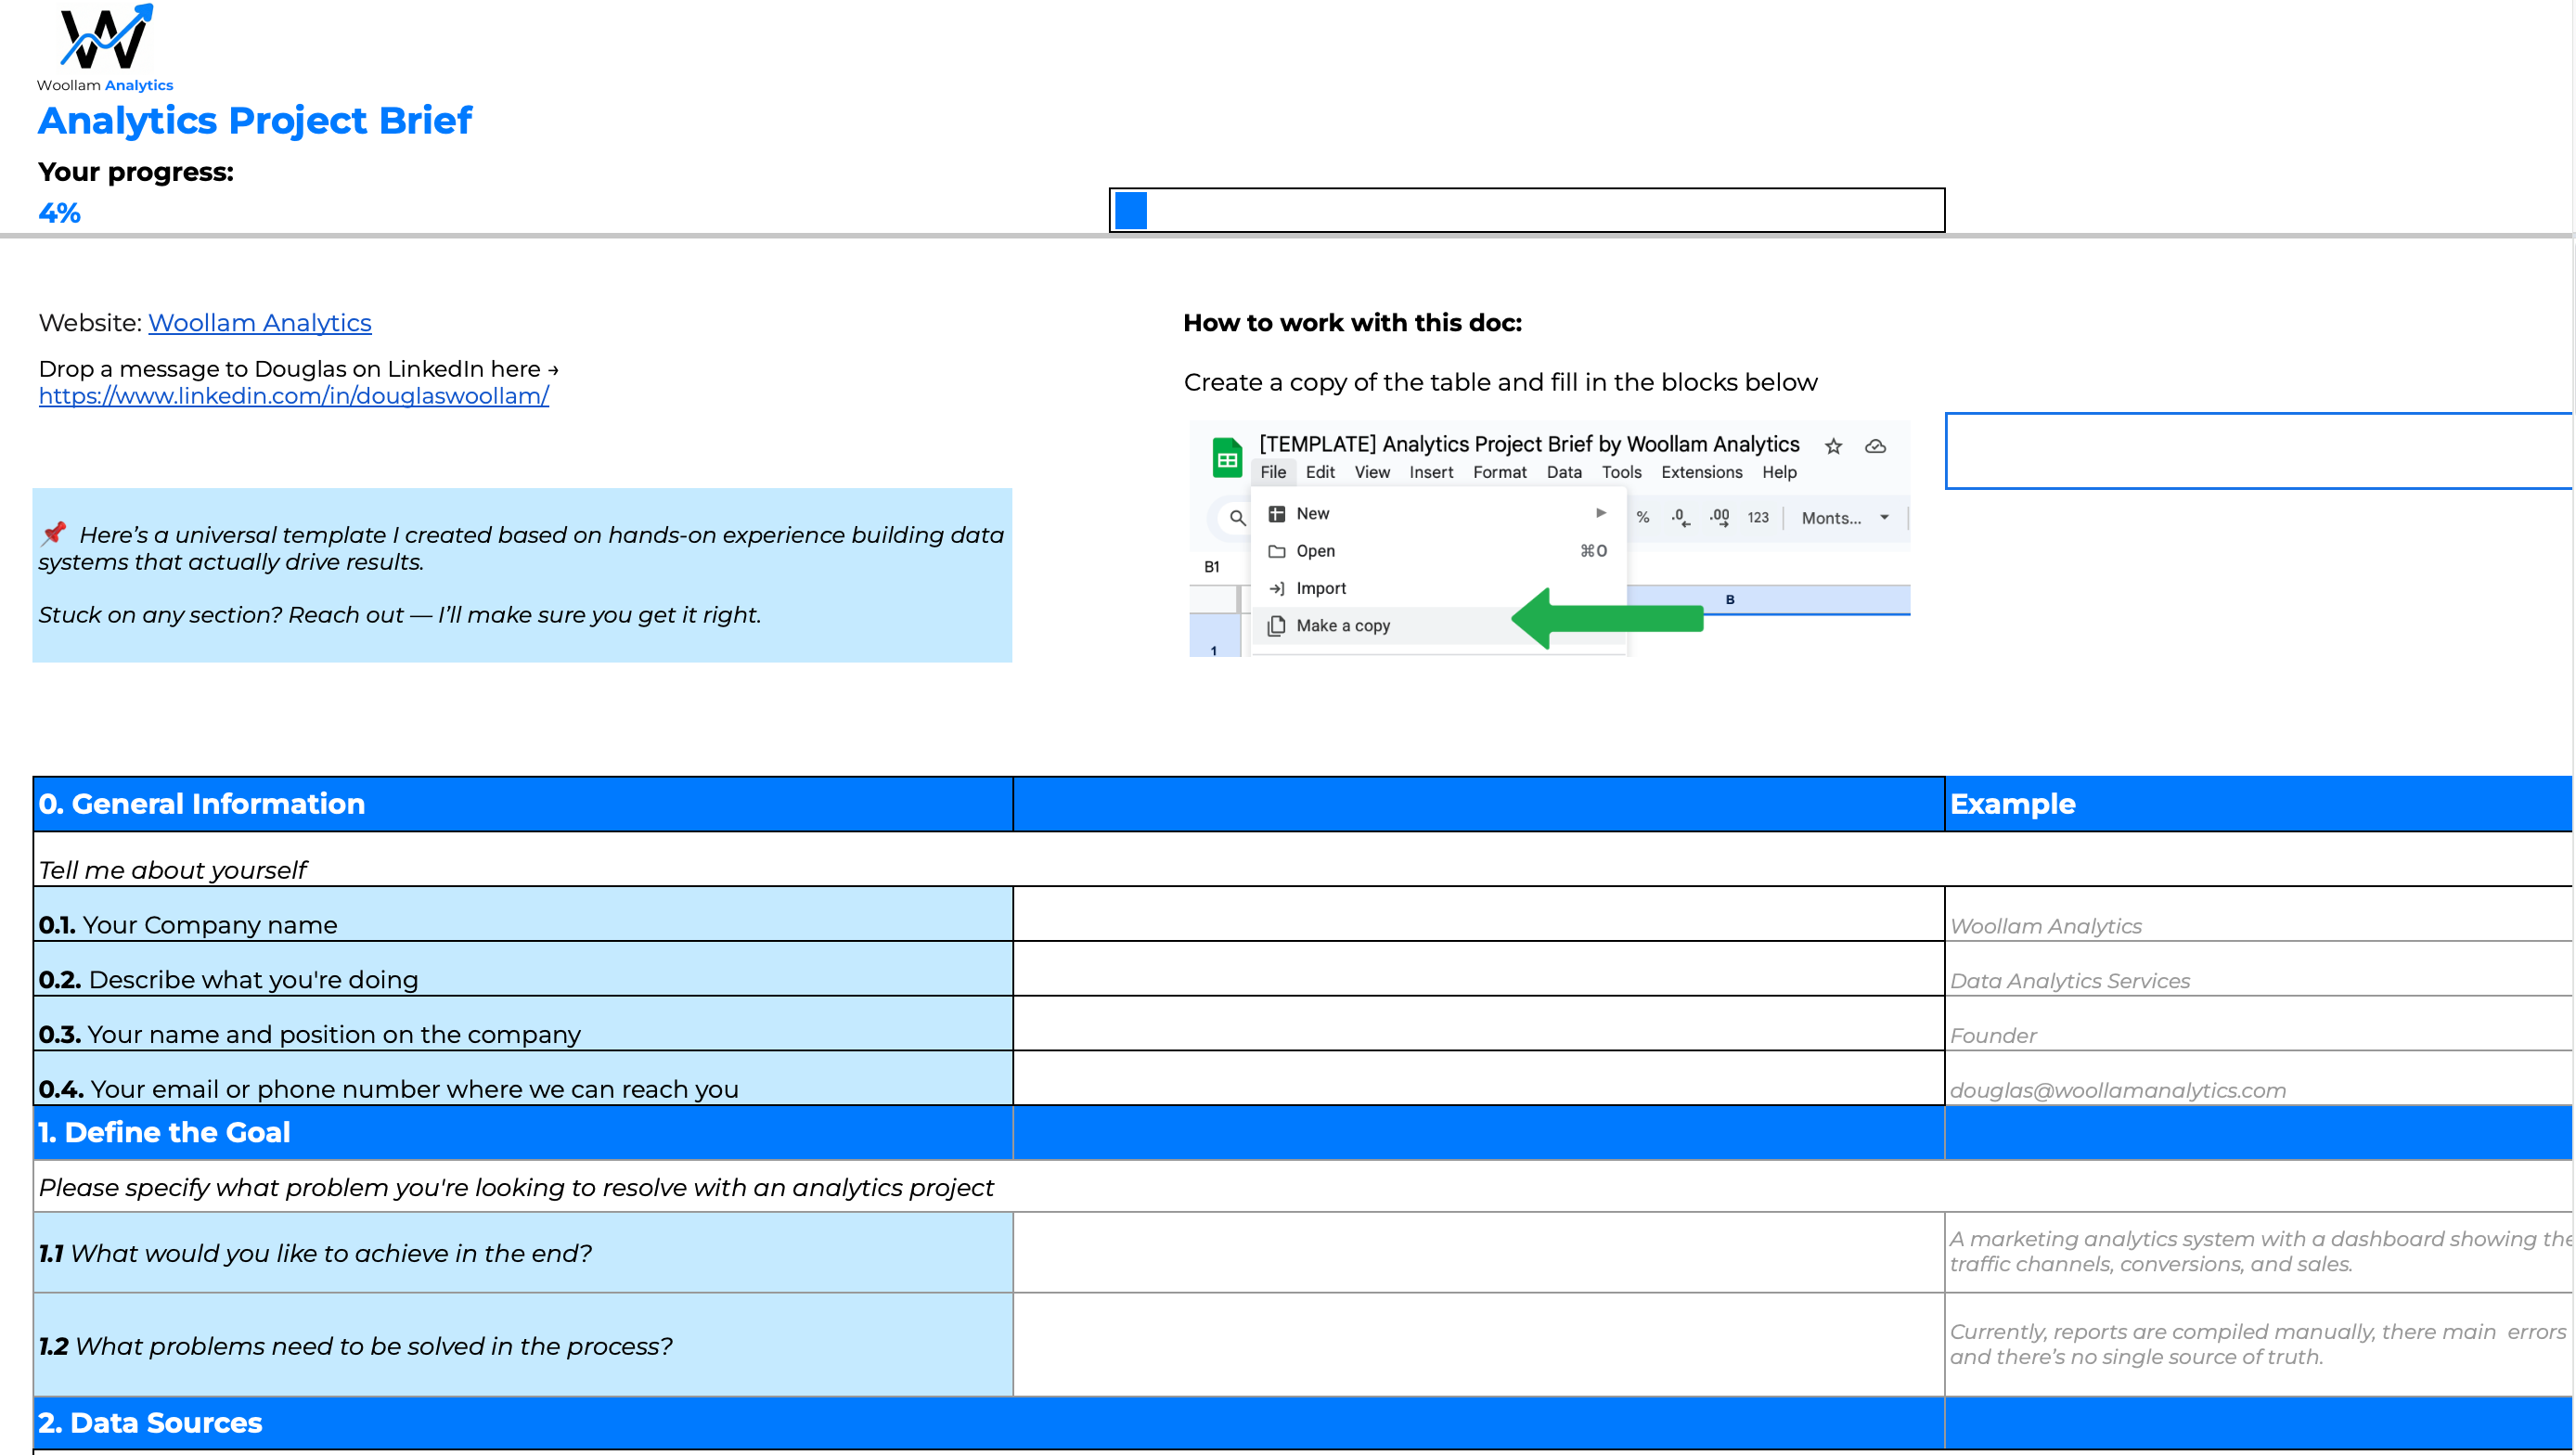
You leave with a written spec and a fixed price, and the diagnostic fee comes off the build. It's a scoped roadmap, so you decide with real numbers in front of you rather than a guess.
I design to that spec: layout and wireframes for a dashboard, backend work for a reporting rebuild, or learning your business rules so agentic AI can run an automation safely.
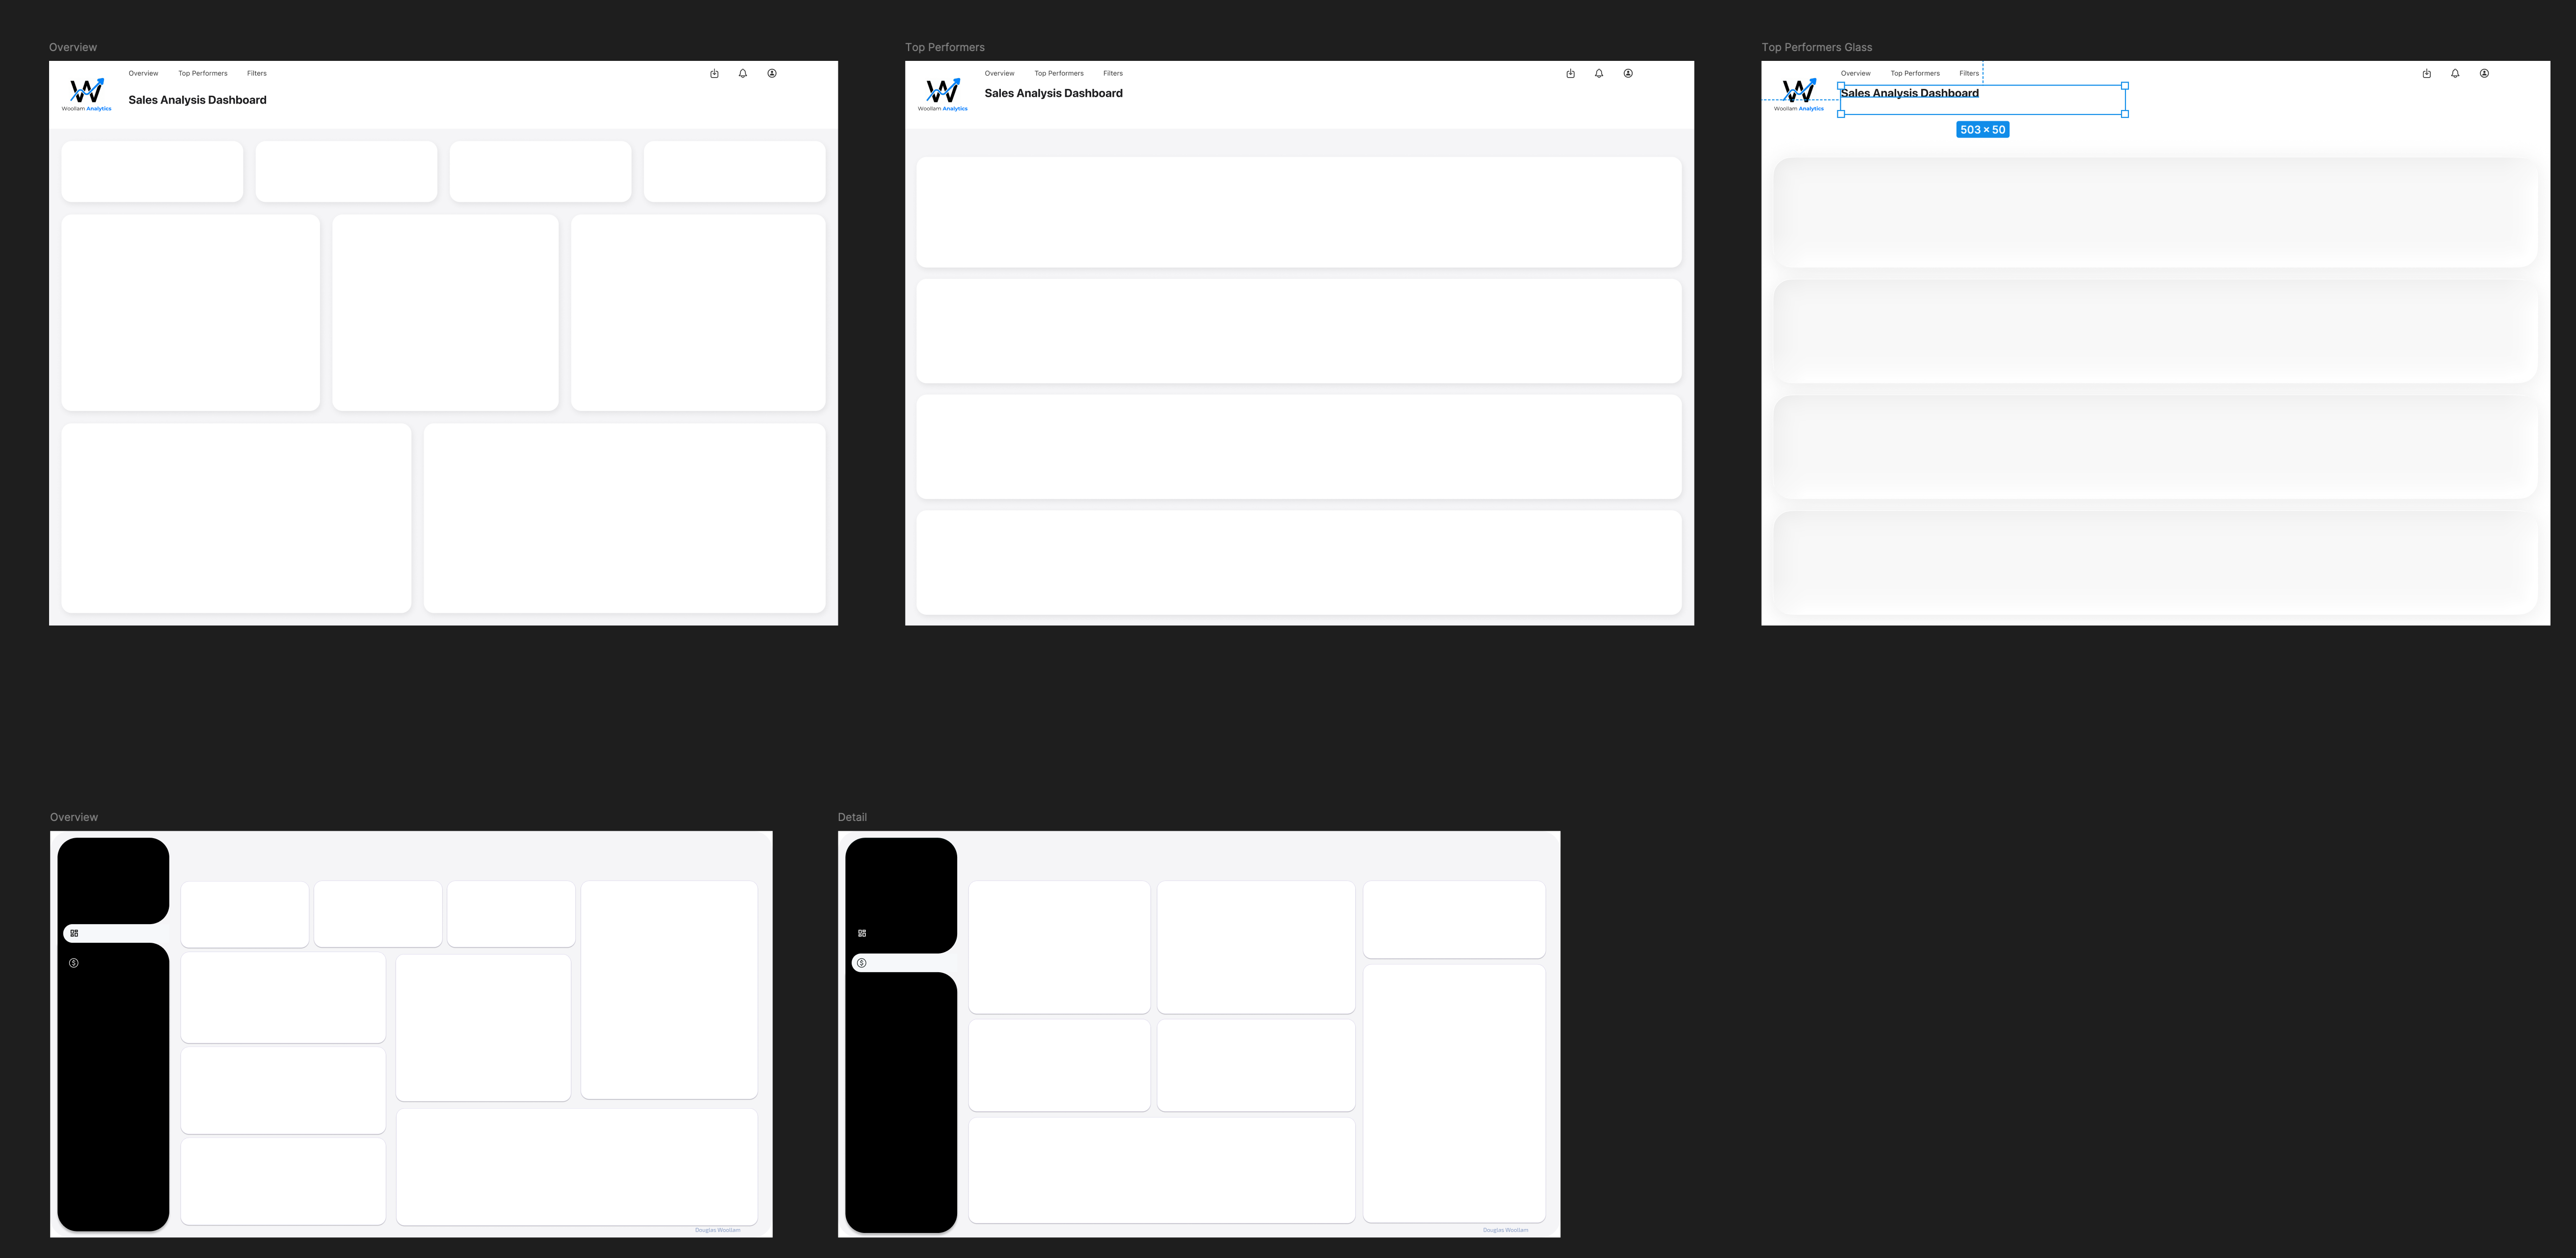
You get a first working version and a short walkthrough video covering the design, the KPIs, and how to explore it yourself. You see it working long before the end.
You review and tell me what's off. I make the revisions that are part of your build and tune it to match how your business actually runs.
Polished, running on your live data, with insights and recommended actions where they help. You own the source and the workbooks, with no lock-in.
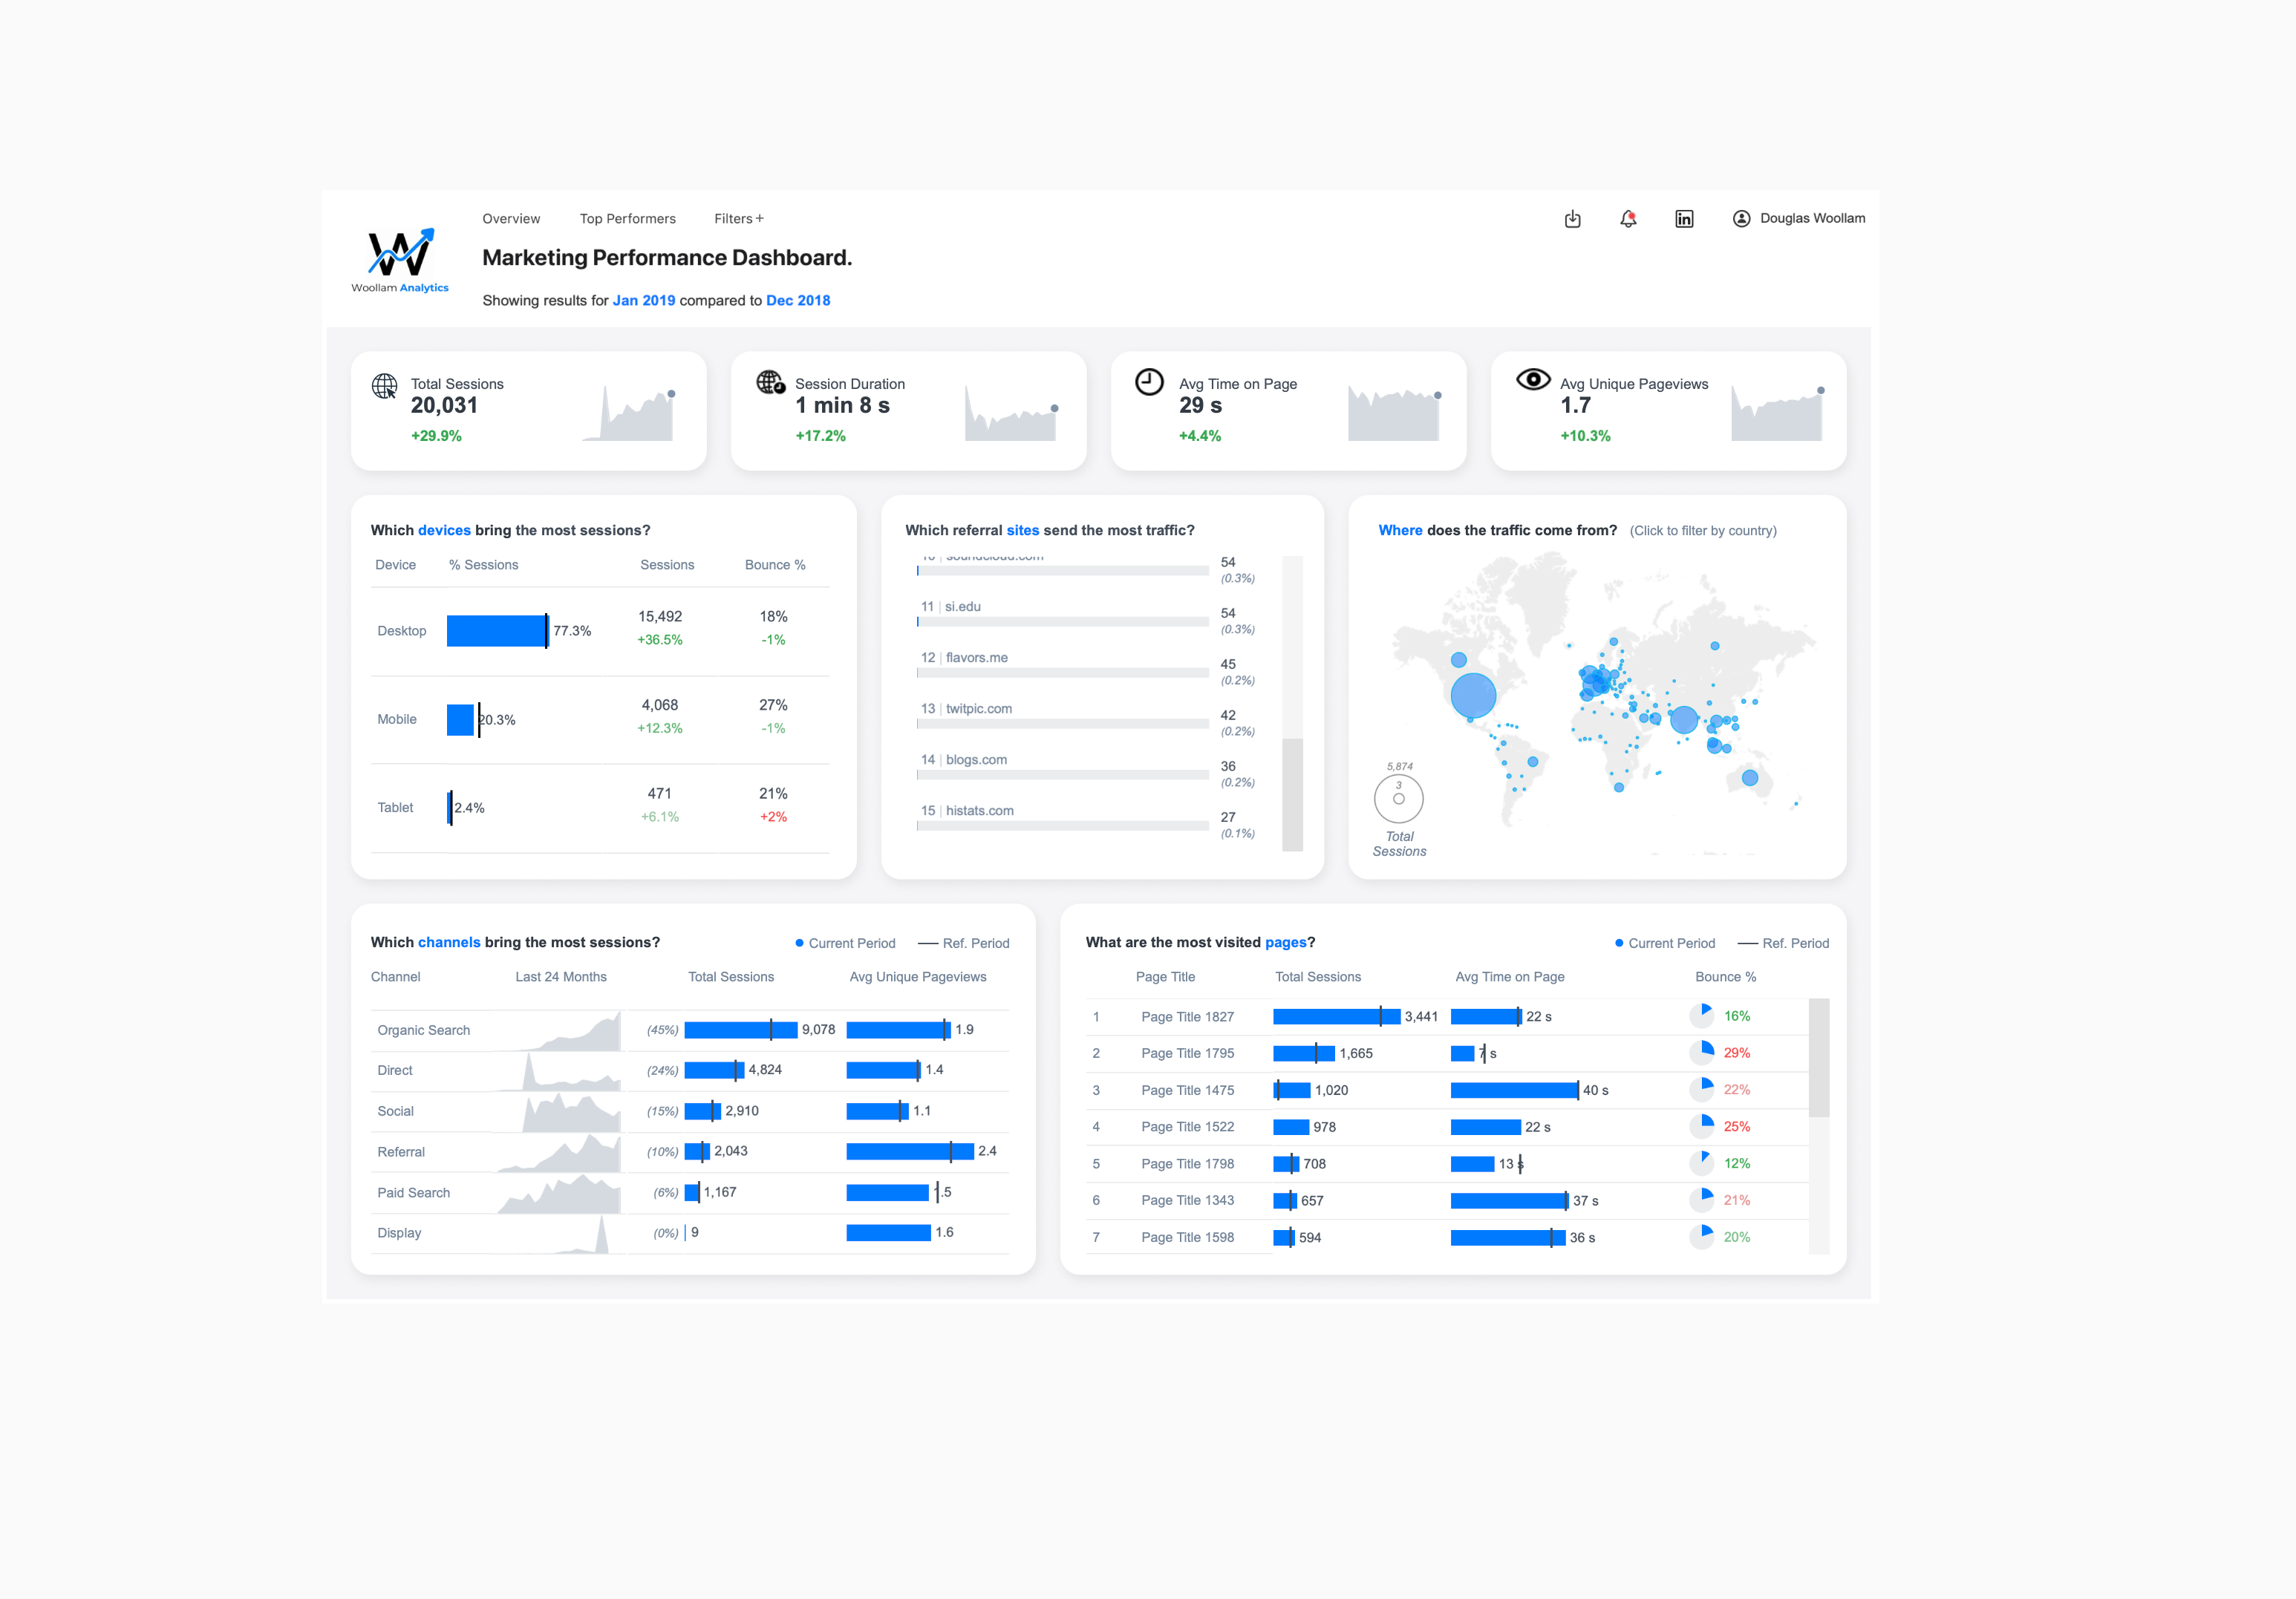
Marketing performance dashboard — overview
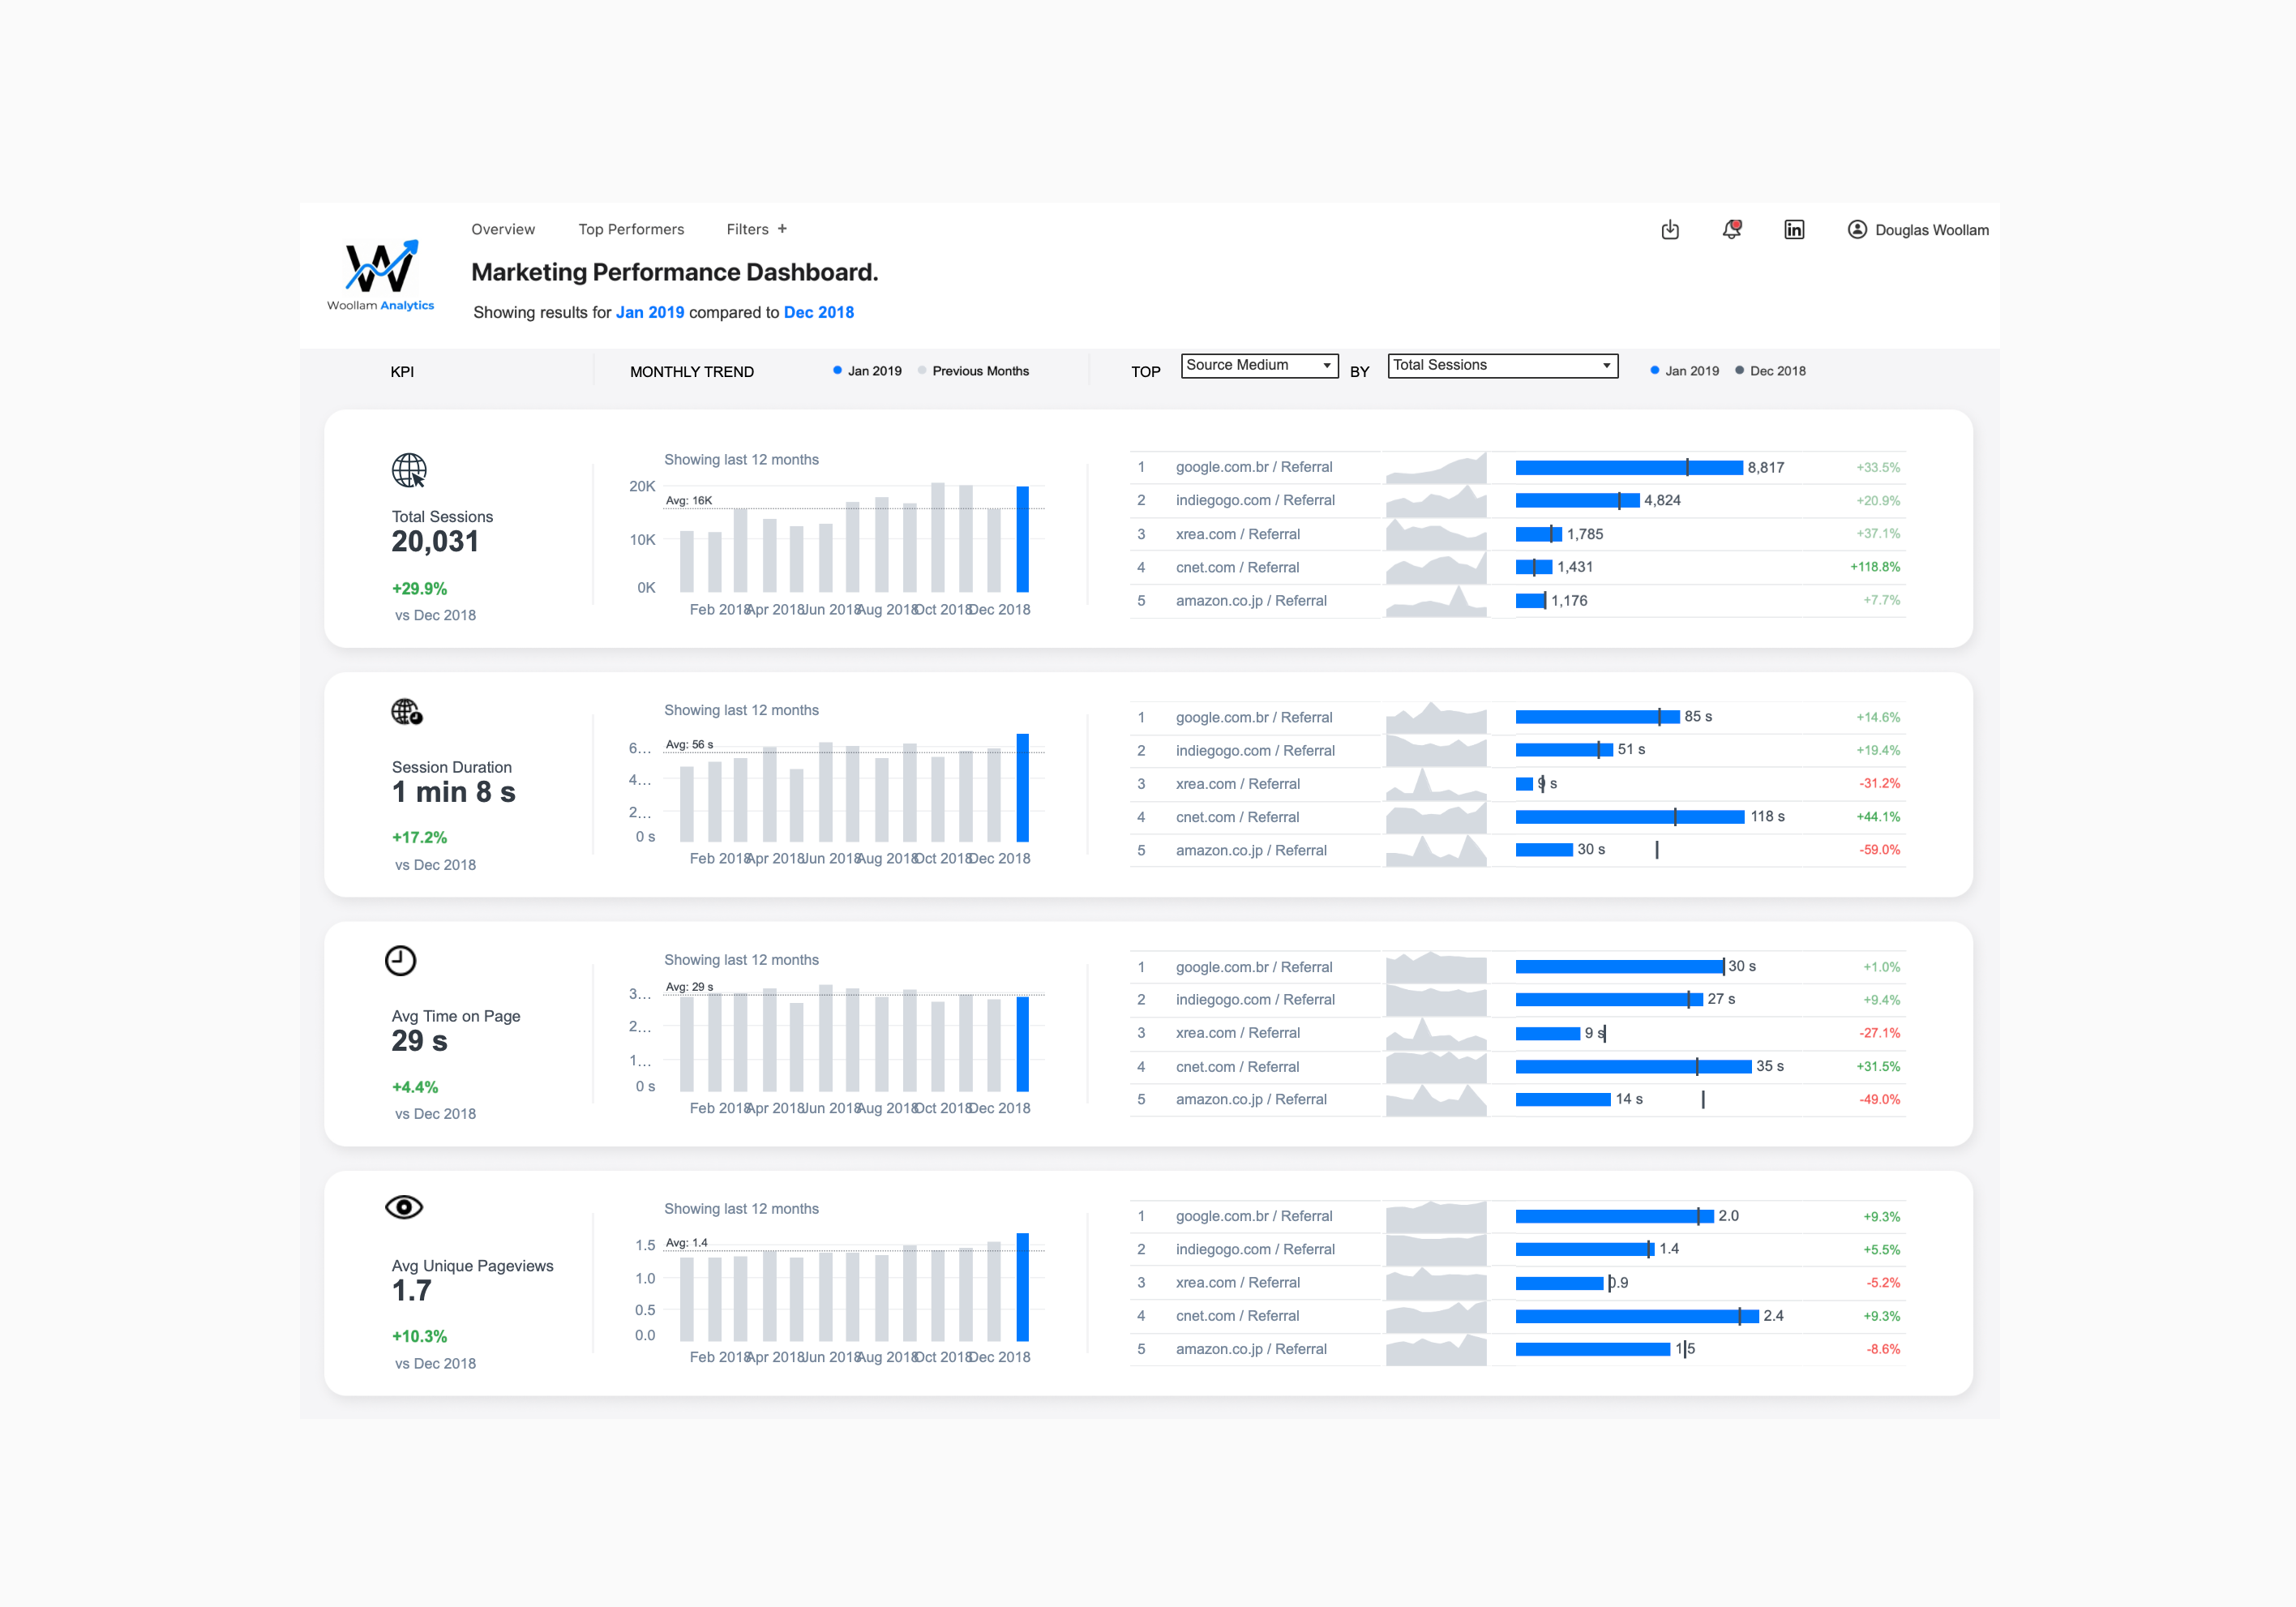
Marketing performance dashboard — top performers
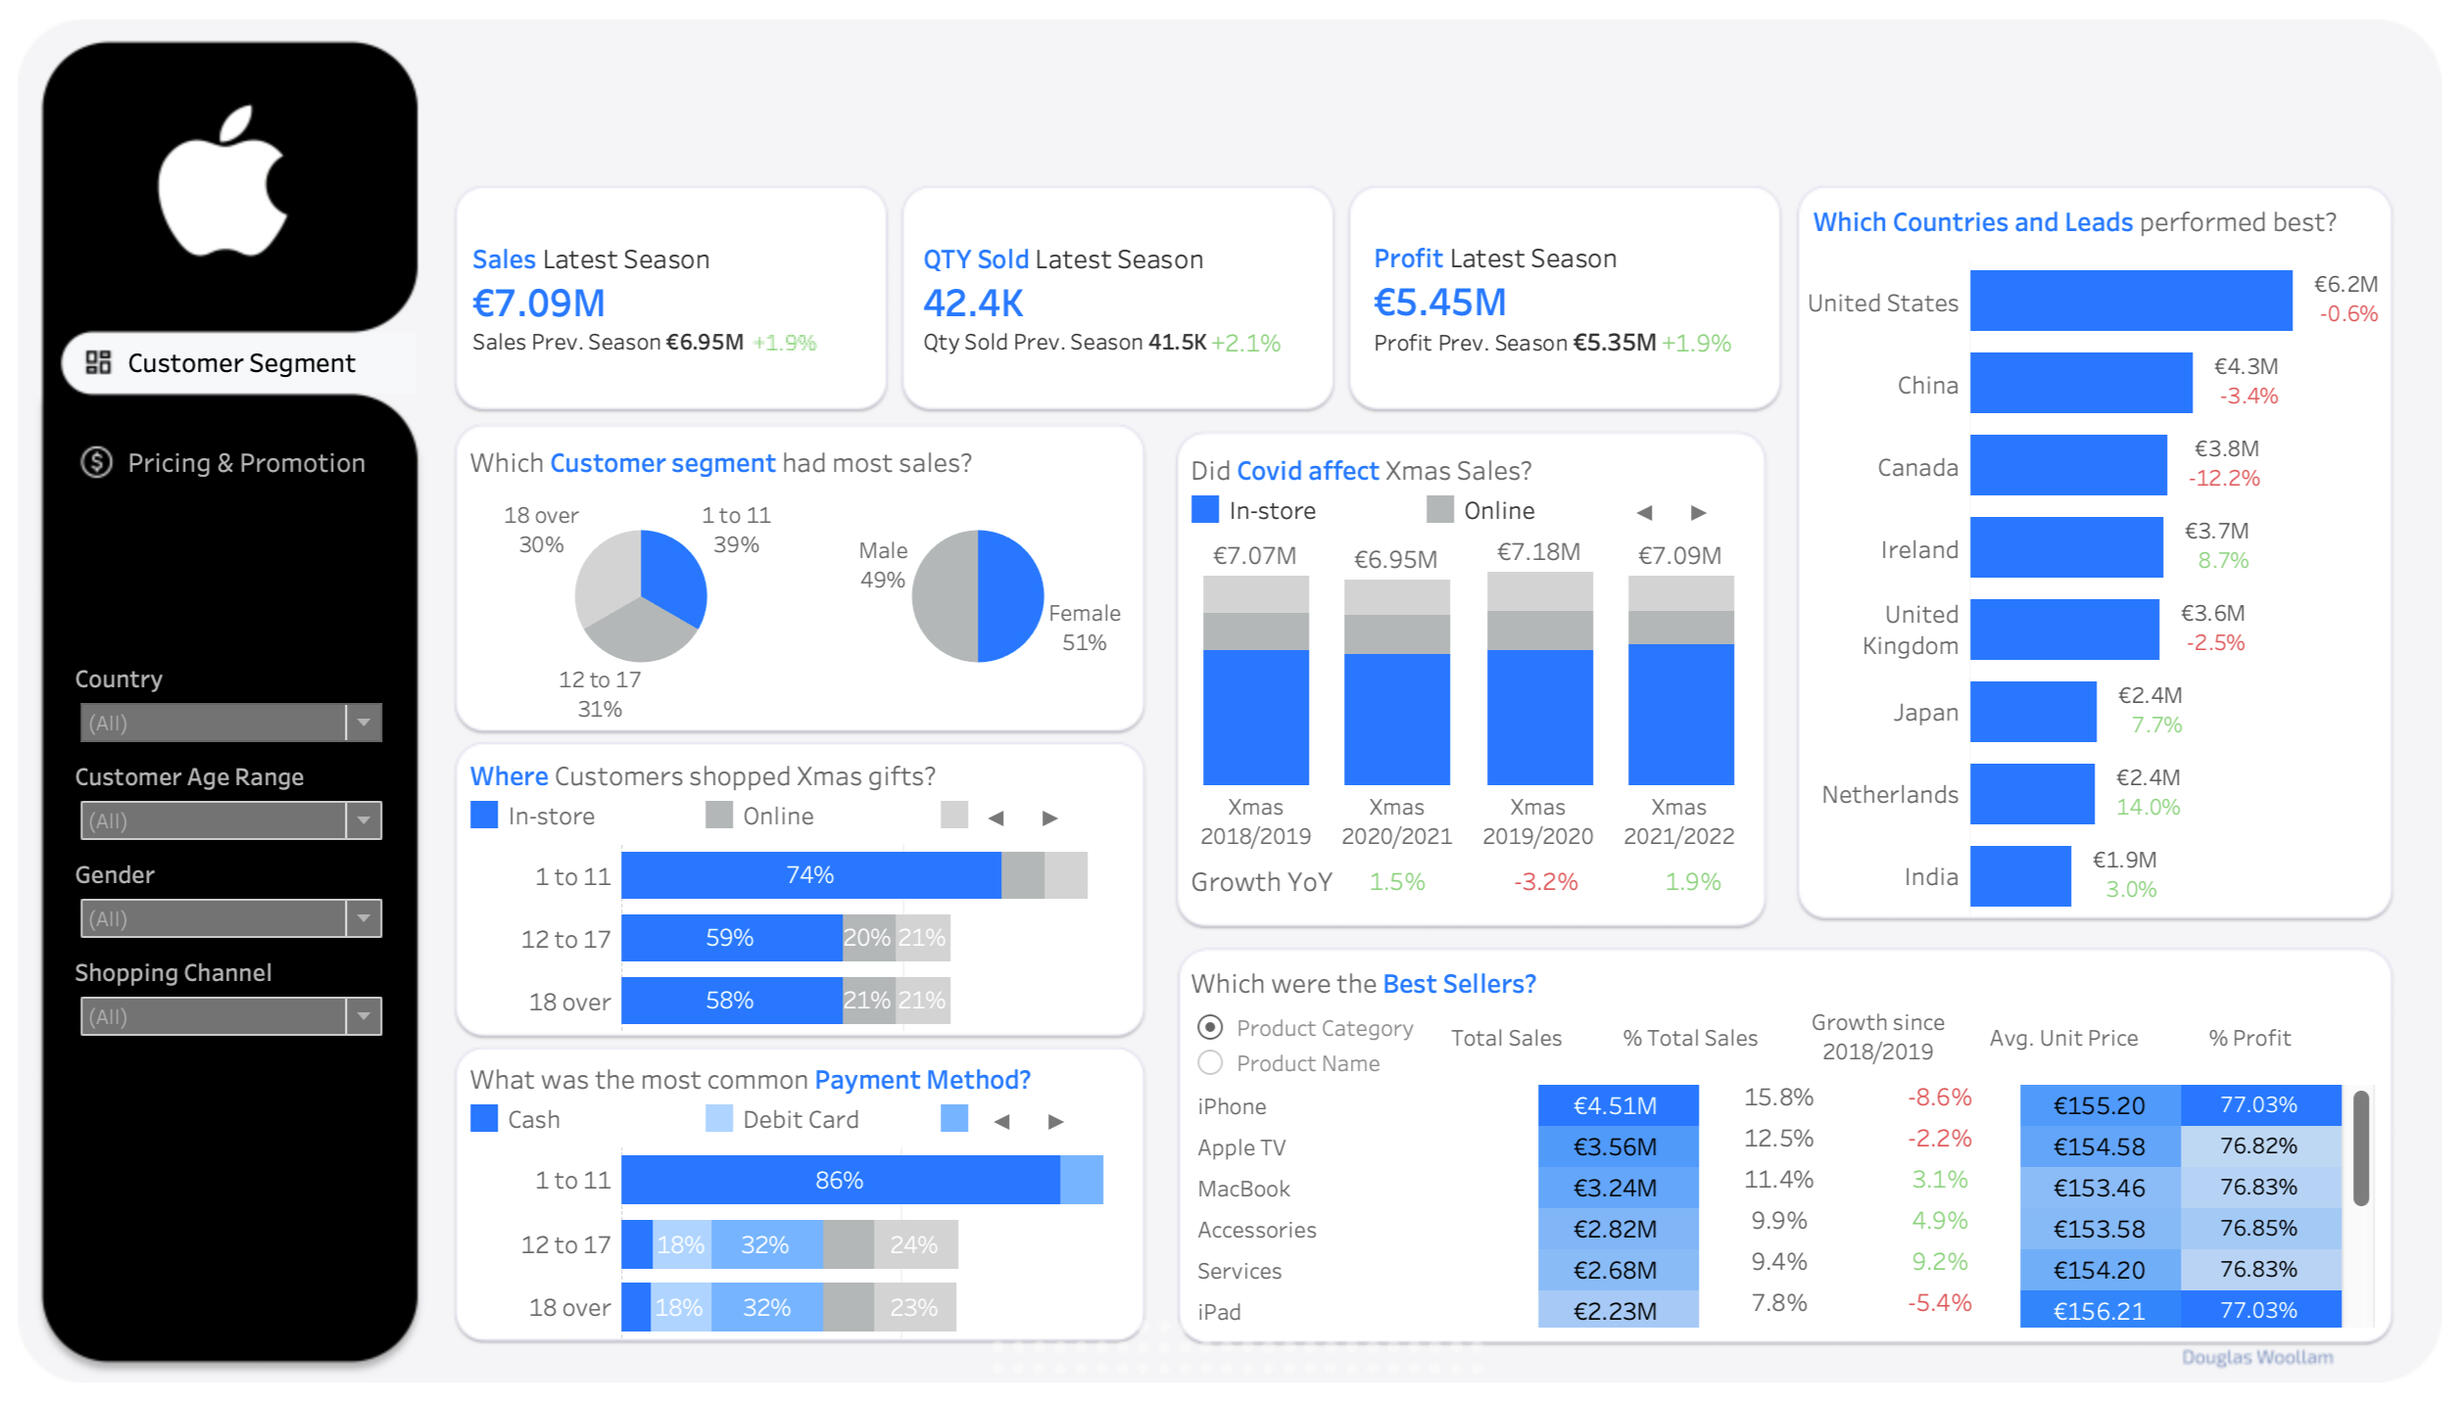
Christmas sales analysis — customer segments
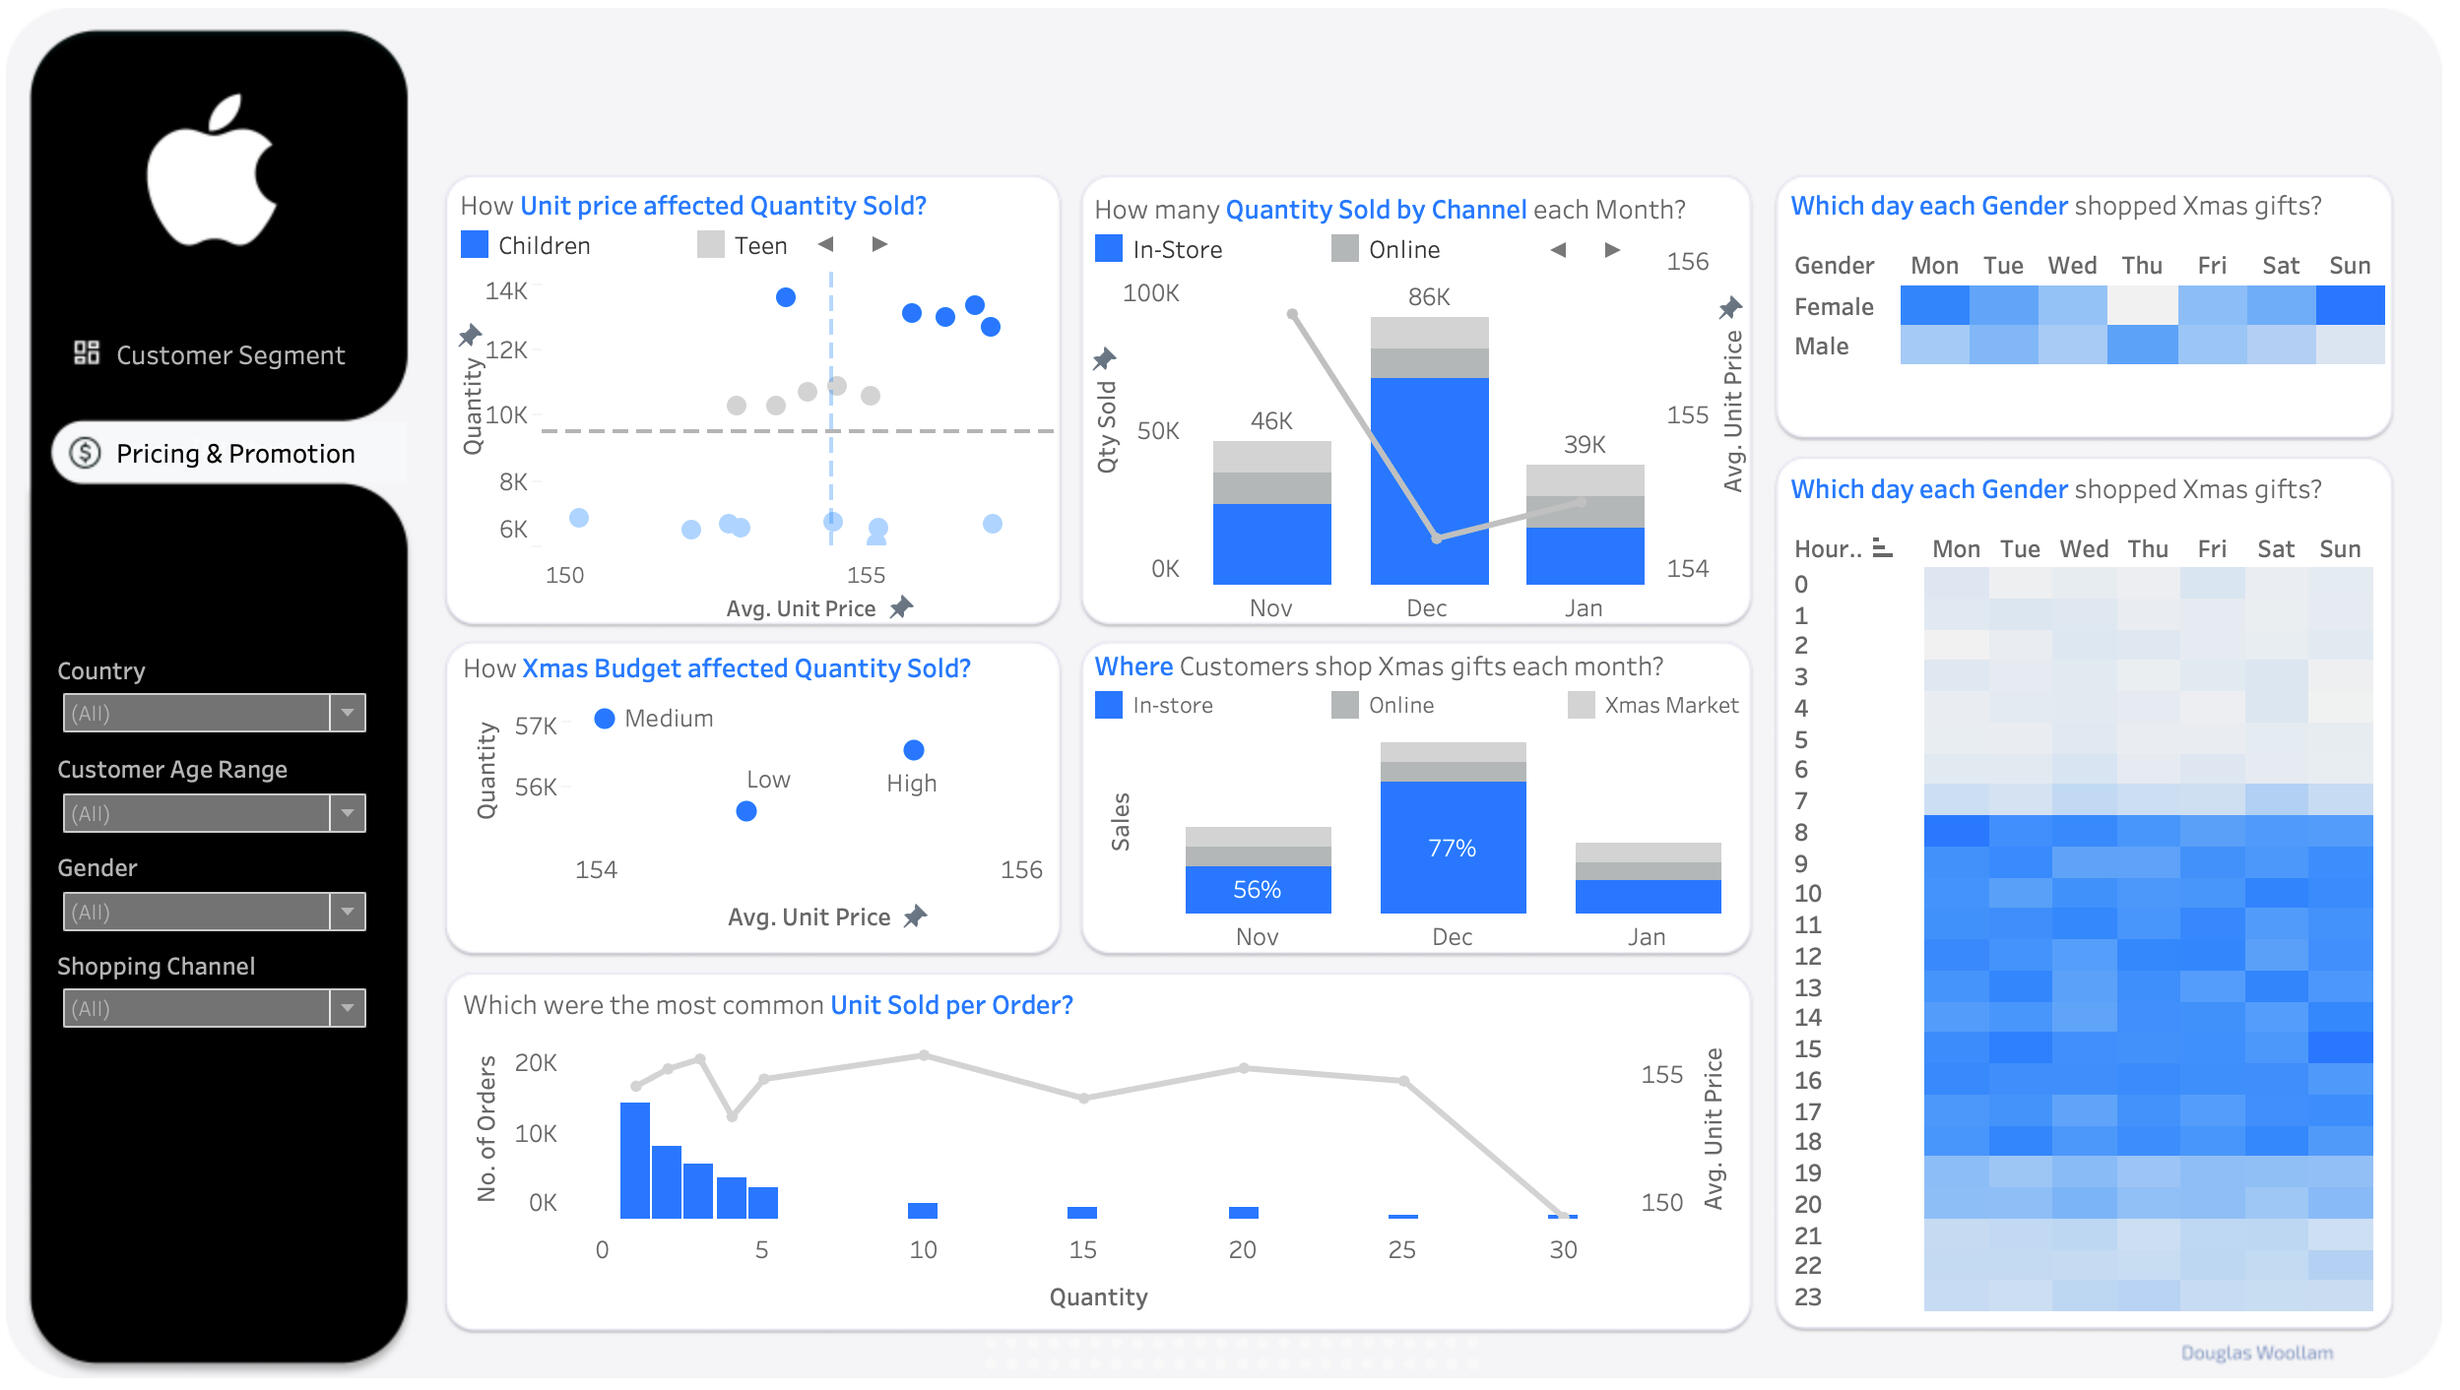
Christmas sales analysis — pricing and promotion
Want it kept live? A rolling retainer keeps your systems reliable and gives you senior capacity without a full-time hire. Each month covers a set number of changes, or new automated workflows and agent skills.
The first step is the diagnostic. Book a discovery call
I've built the reporting and approval systems a large enterprise sales operation ran on, and delivered a paying client a live profit dashboard that lifted gross profit 20%. You don't have to take that on faith: we start with a low-risk paid diagnostic, so you see how I work and what I find before committing to a build.
You work directly with the person who does the work, with no juniors and no hand-offs. Everything is documented: runbooks, monitoring and the source in your own repository, so your team can run it without me. For continuity, the retainer keeps a named owner on your systems, and I'll always be honest about capacity before we start.
That's exactly why automation ships with a governance layer: human-in-the-loop, audit trails, rollback and edge-case handling, validated in a UAT-and-hardening phase before it touches production. For sensitive or regulated-adjacent decisions I lead with dashboards or forecasting first, where the blast radius is lower.
A contractor takes a spec and bills days. A large firm puts juniors behind a partner. You get one senior person who diagnoses the problem, owns the outcome, and hands over a documented system: fixed scope, no layers, no day-rate clock and no RFP.
Because I won't quote a build blind. The diagnostic quantifies the cost of the problem in your numbers and produces a written spec with acceptance criteria, so the build is fixed-scope and de-risked for both of us. The fee is credited in full against the build.
Builds are value-priced against the outcome and scoped from the diagnostic, not billed by the day. Fixed scope with a change-order clause means the price holds, and my speed is my problem to solve, not your cost to carry.
I'll sign an NDA on request, work with least-privilege access and on a copy where possible, and delete data on completion. For any automated decisioning I build in the human oversight and audit trail GDPR Article 22 expects.
You own the source, the runbooks and a documented, monitored system, with a defined support window. Keep it in-house, or take the retainer and I'll maintain and evolve it: capacity without a full-time hire.
Tell me what's breaking, roughly what it's costing, and what you've tried. If it's a fit, we start with a paid diagnostic; if it isn't, I'll say so and point you somewhere better.
Engagements start with a paid diagnostic (from €1,500, credited to your build). If you need a few hours of ad-hoc analysis, I'm probably not the right fit, and I'll happily point you to someone who is.
Prefer to scope it out first? Grab the project brief, or see how working together works.
Find at least 5 hours of recurring work AI can remove from your week — and get a prioritised plan showing exactly what to do next.
Best for: a busy owner or team lead who knows they should be using AI, but has no time to test 40 tools to find the three that matter.
Reclaim 5–10 hours a week, and most clients earn it back in the first week.
Your chosen workflow built, tested and handed over.
Best for: you’ve seen the plan, you want the time back now, and you’d rather not spend your evenings wiring up tools yourself.
One defined workflow improved or automated each month, with senior support between sessions.
Best for: a founder or team that wants to keep finding and fixing time drains every month, without hiring for it.
A fresh bottleneck found and automated every month.
Good to know: larger one-off builds beyond the calls are scoped separately.
Each framework is a building block of your AI infrastructure, designed to automate, connect, and scale your operations with precision.
Thanks for calling Knipe’s Luxury Garage! Who am I speaking with?
Hi, it’s Patrick.
Great to meet you, Patrick. Are you calling about your service booking?
Yeah, is tomorrow morning still good?
You’re booked in for 10 AM tomorrow. I’ll text a reminder tonight.
Understands context and tone, providing human-like voice responses instantly.
Identifies caller needs and directs them to the right team automatically.
Logs every call, sentiment, and action directly into your dashboard for review.
Handles inbound inquiries 24/7 with consistent quality and zero downtime.
Hi 👋 I’m your AI assistant. How can I help today?
Do you have any slots free tomorrow around noon?
We do! 12 PM tomorrow is open. Can I take your address?
Sure, 22 Glenanaar, Mallow.
Perfect, you’re booked in. See you at noon tomorrow!
Responds naturally across channels while maintaining your brand’s tone.
Uses trained data to answer questions instantly and reduce support workload.
Remembers interactions to create smooth, continuous customer experiences.
Measures chat volume, response rate, and satisfaction inside one unified dashboard.
Connects CRMs, forms, and apps to automate repetitive business operations.
Executes precise actions automatically based on data changes or user activity.
Replaces hours of manual tasks with intelligent end-to-end workflow logic.
Monitors automation status, success rates, and ROI metrics in one place.
A single dashboard for every call answered, message handled, and hour your team gets back — so every decision is backed by what’s actually happening.


Every agent, automation, and data source in one place — nothing left for you to stitch together.
Response times, volumes, and hours saved — updated the moment they change.
Pause, adjust, or hand any automation back to a human — all from one screen.
Every stage of working together, so you know what to expect before you commit.
The €500 front door. Everything here is covered by the 5-hour guarantee.
You pick a slot and pay the €500. That's the only commitment. If the assessment doesn't find you at least five hours a week, you get it all back, so the worst case is a free 45-minute conversation about your business.
We spend 45 minutes on where your week actually goes. I ask, you talk, and I don't pitch anything. The point is to surface the tasks that eat your time and the ones you'd happily never do again.
I take the call away and work through it properly: every pain point pulled out, then off-the-shelf AI tools researched and matched to each one. I right-size every pick to your business, so a four-person team isn't sold enterprise software it doesn't need.
A short, plain-language plan arrives before we next speak: your main time drains, the tools that fix them, and the hours and money you get back. It ends with a 4-day quick start, one small action a day, so an overwhelmed week isn't a reason to stall.
Then we go through the report together, recommendation by recommendation. You decide what's most urgent, and whether you want to run with it yourself or have me build it. If we're done here, you still walk away with a plan worth more than you paid.
AI Tools Assessment — cover
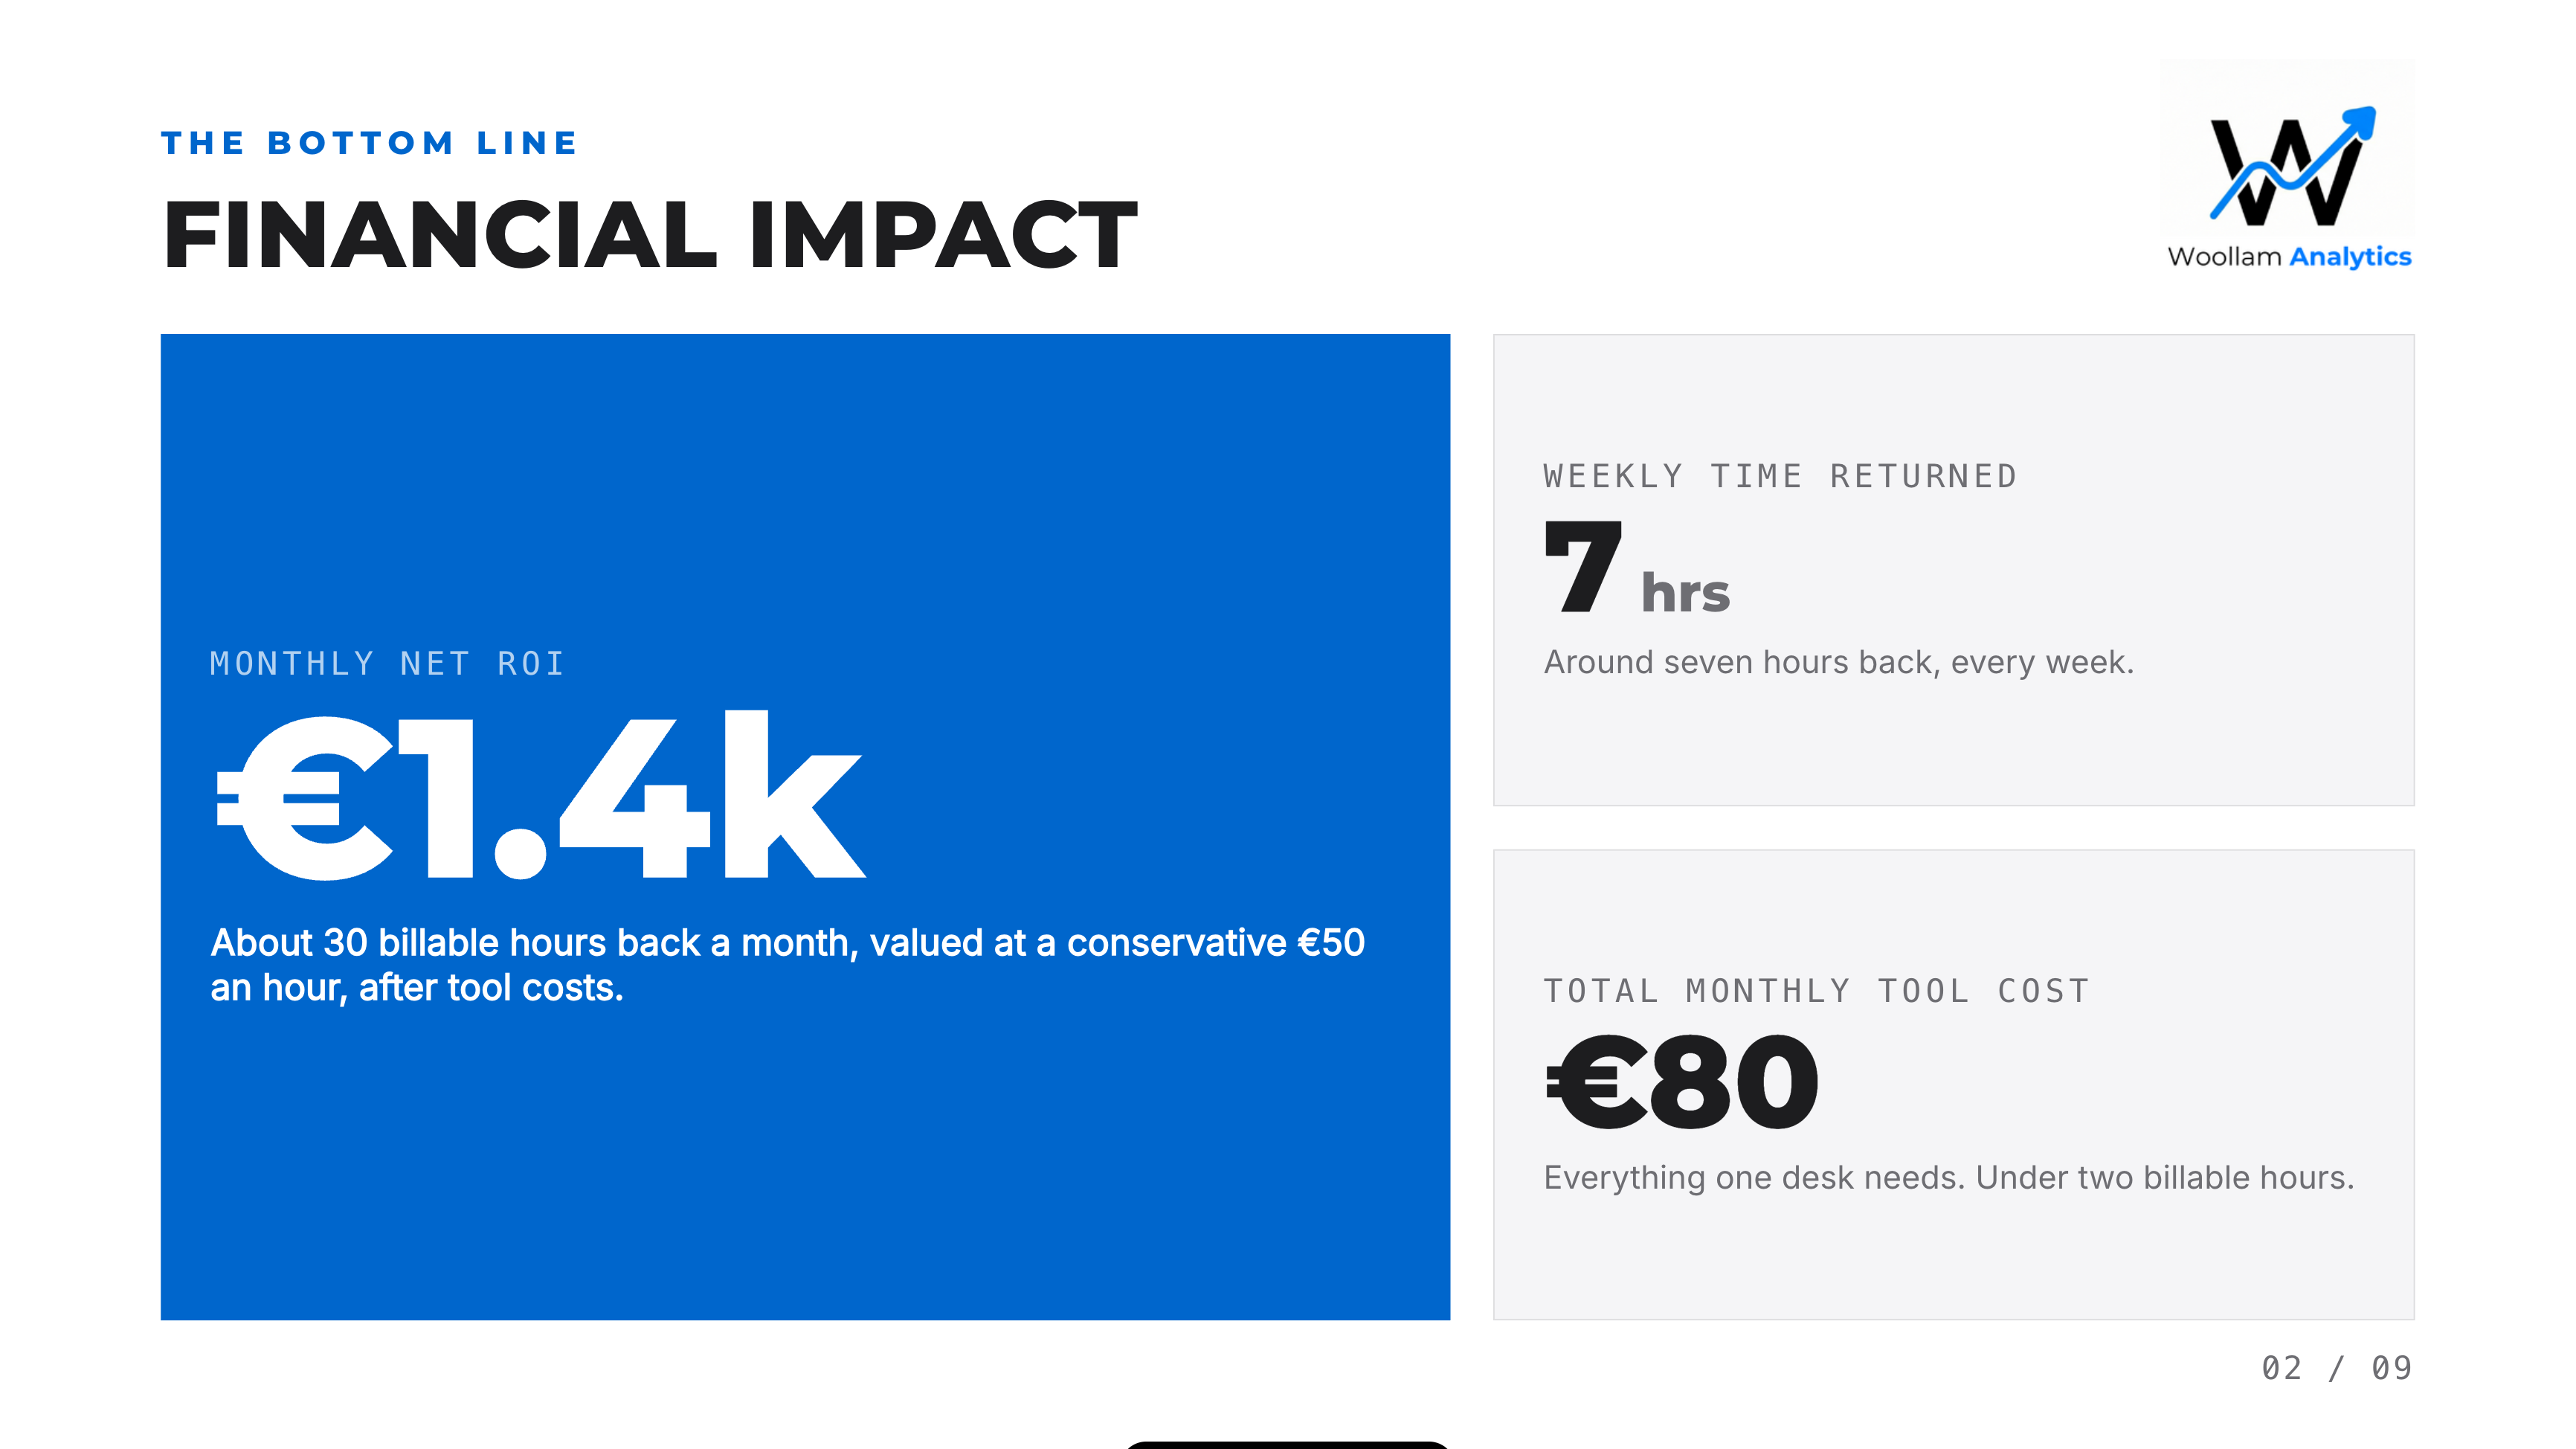
Financial impact — the ROI in your numbers
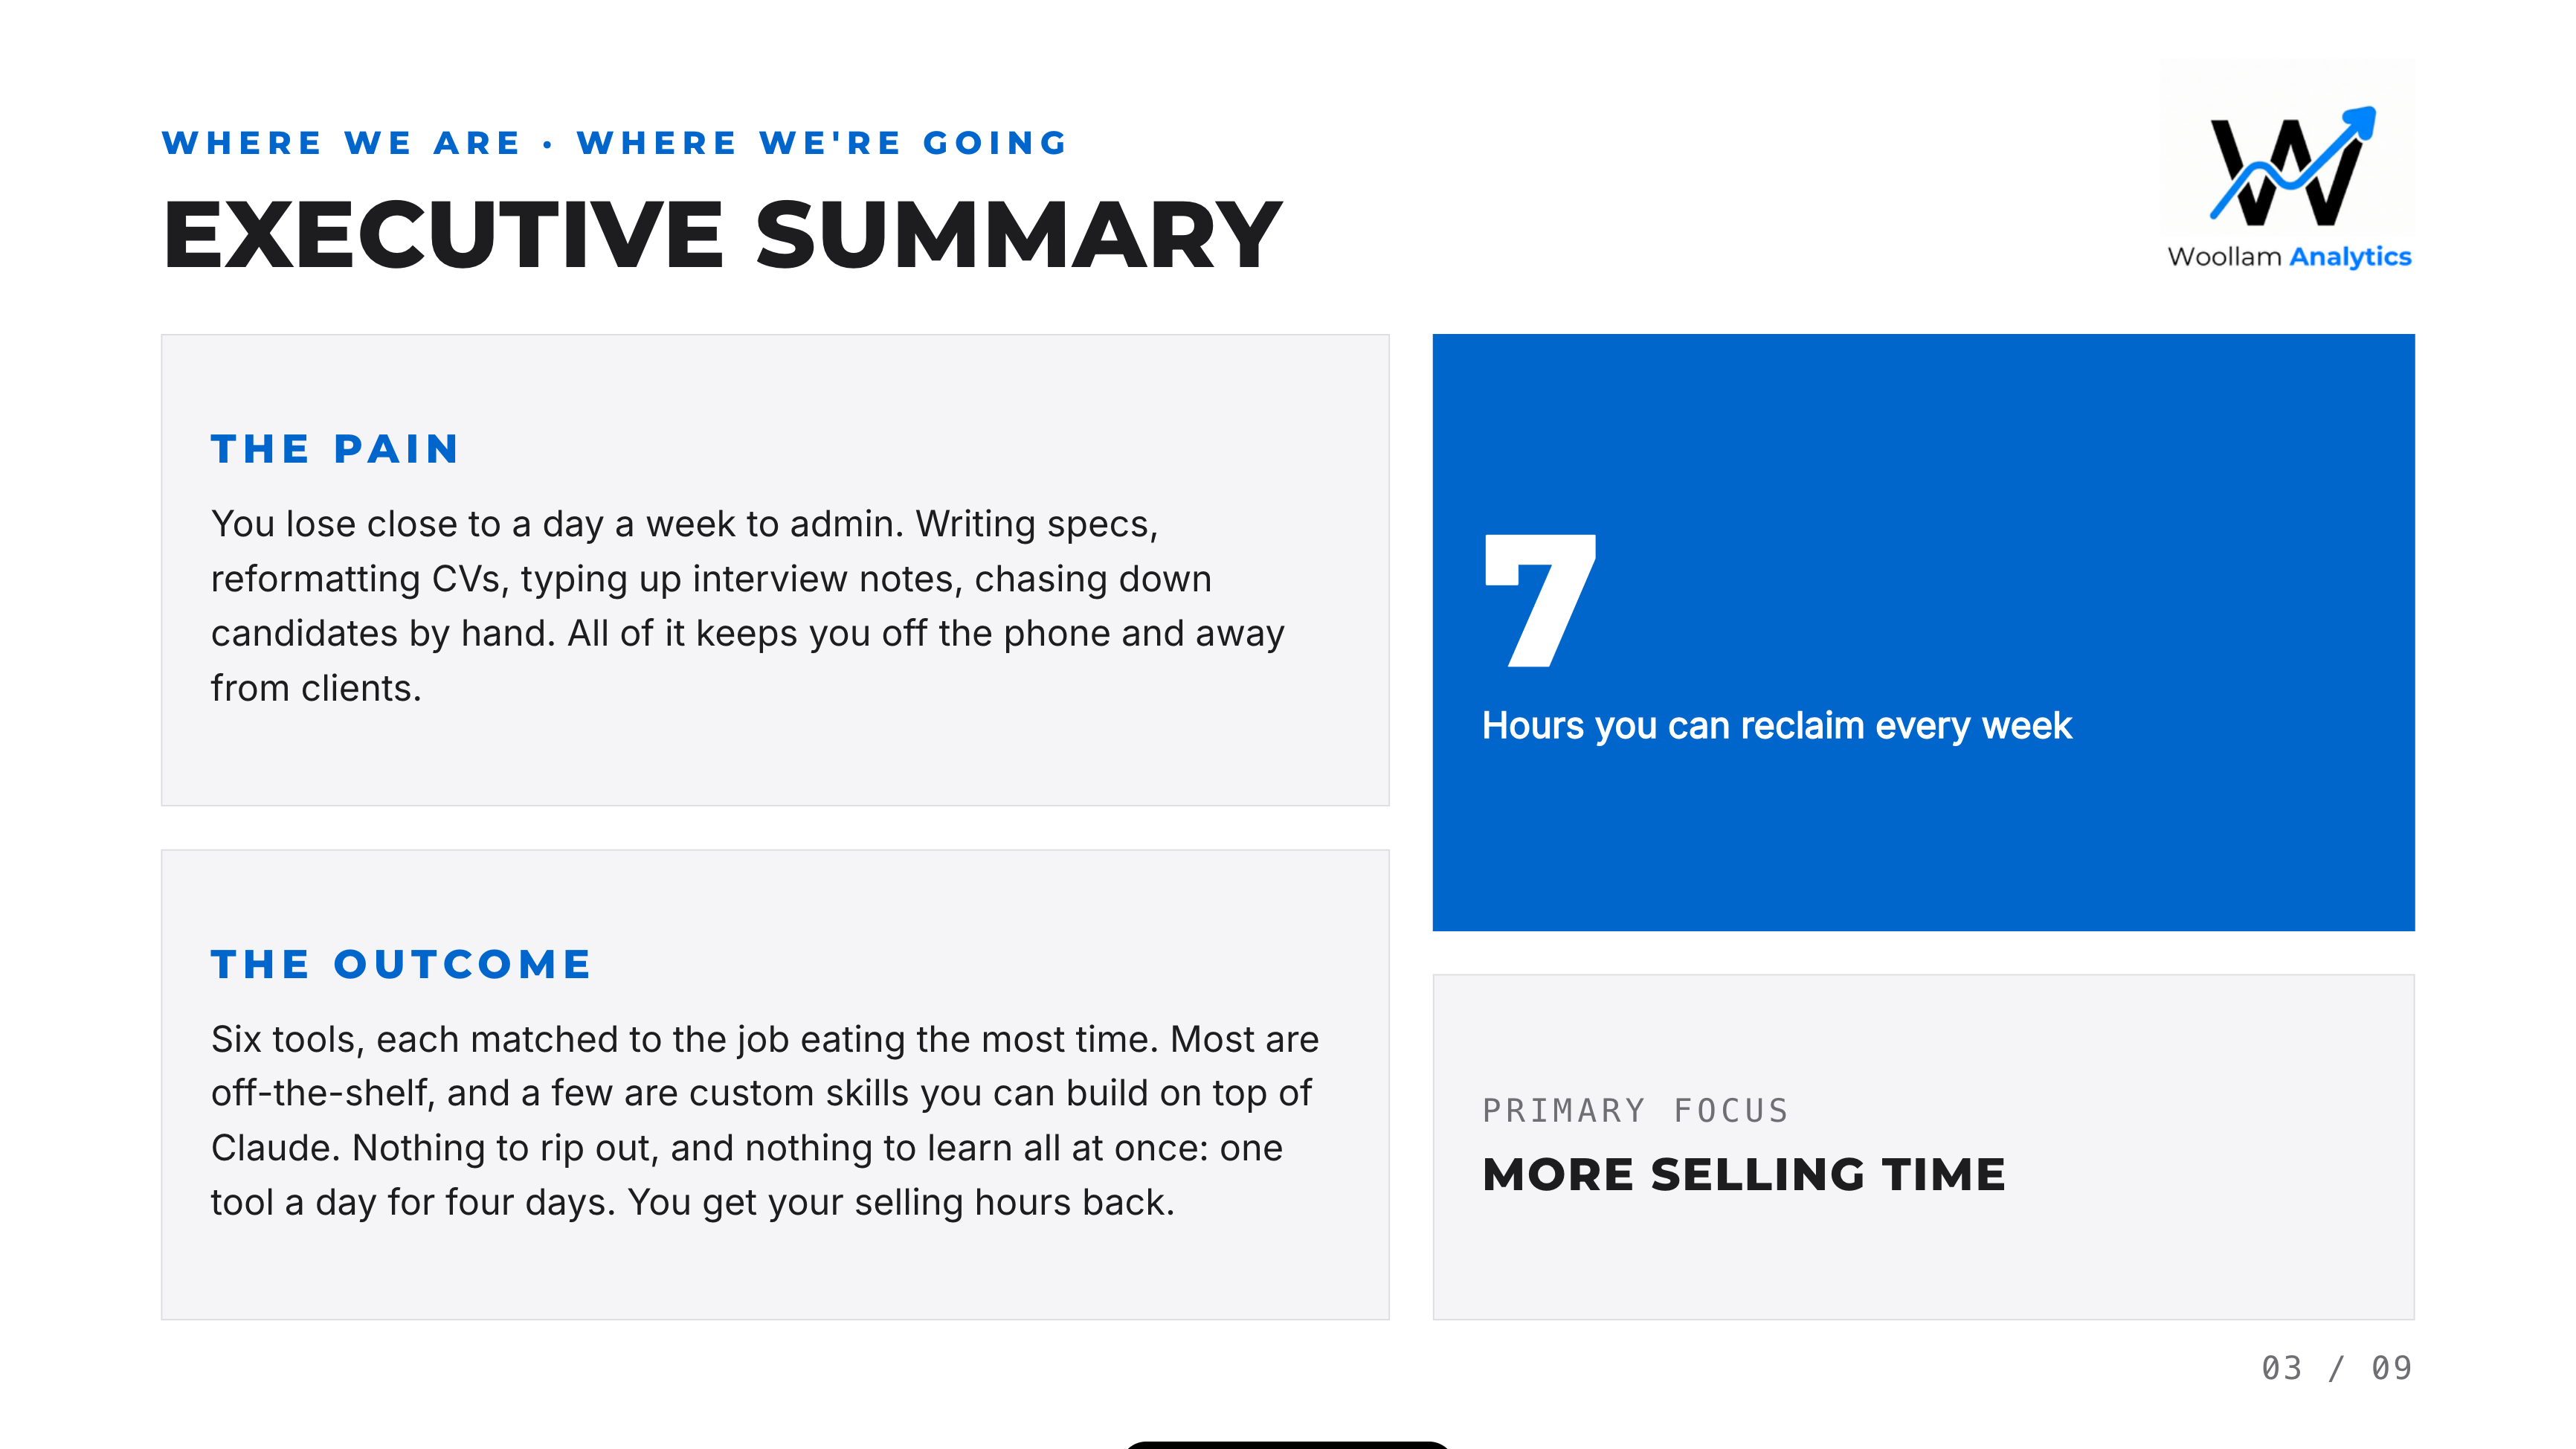
Executive summary
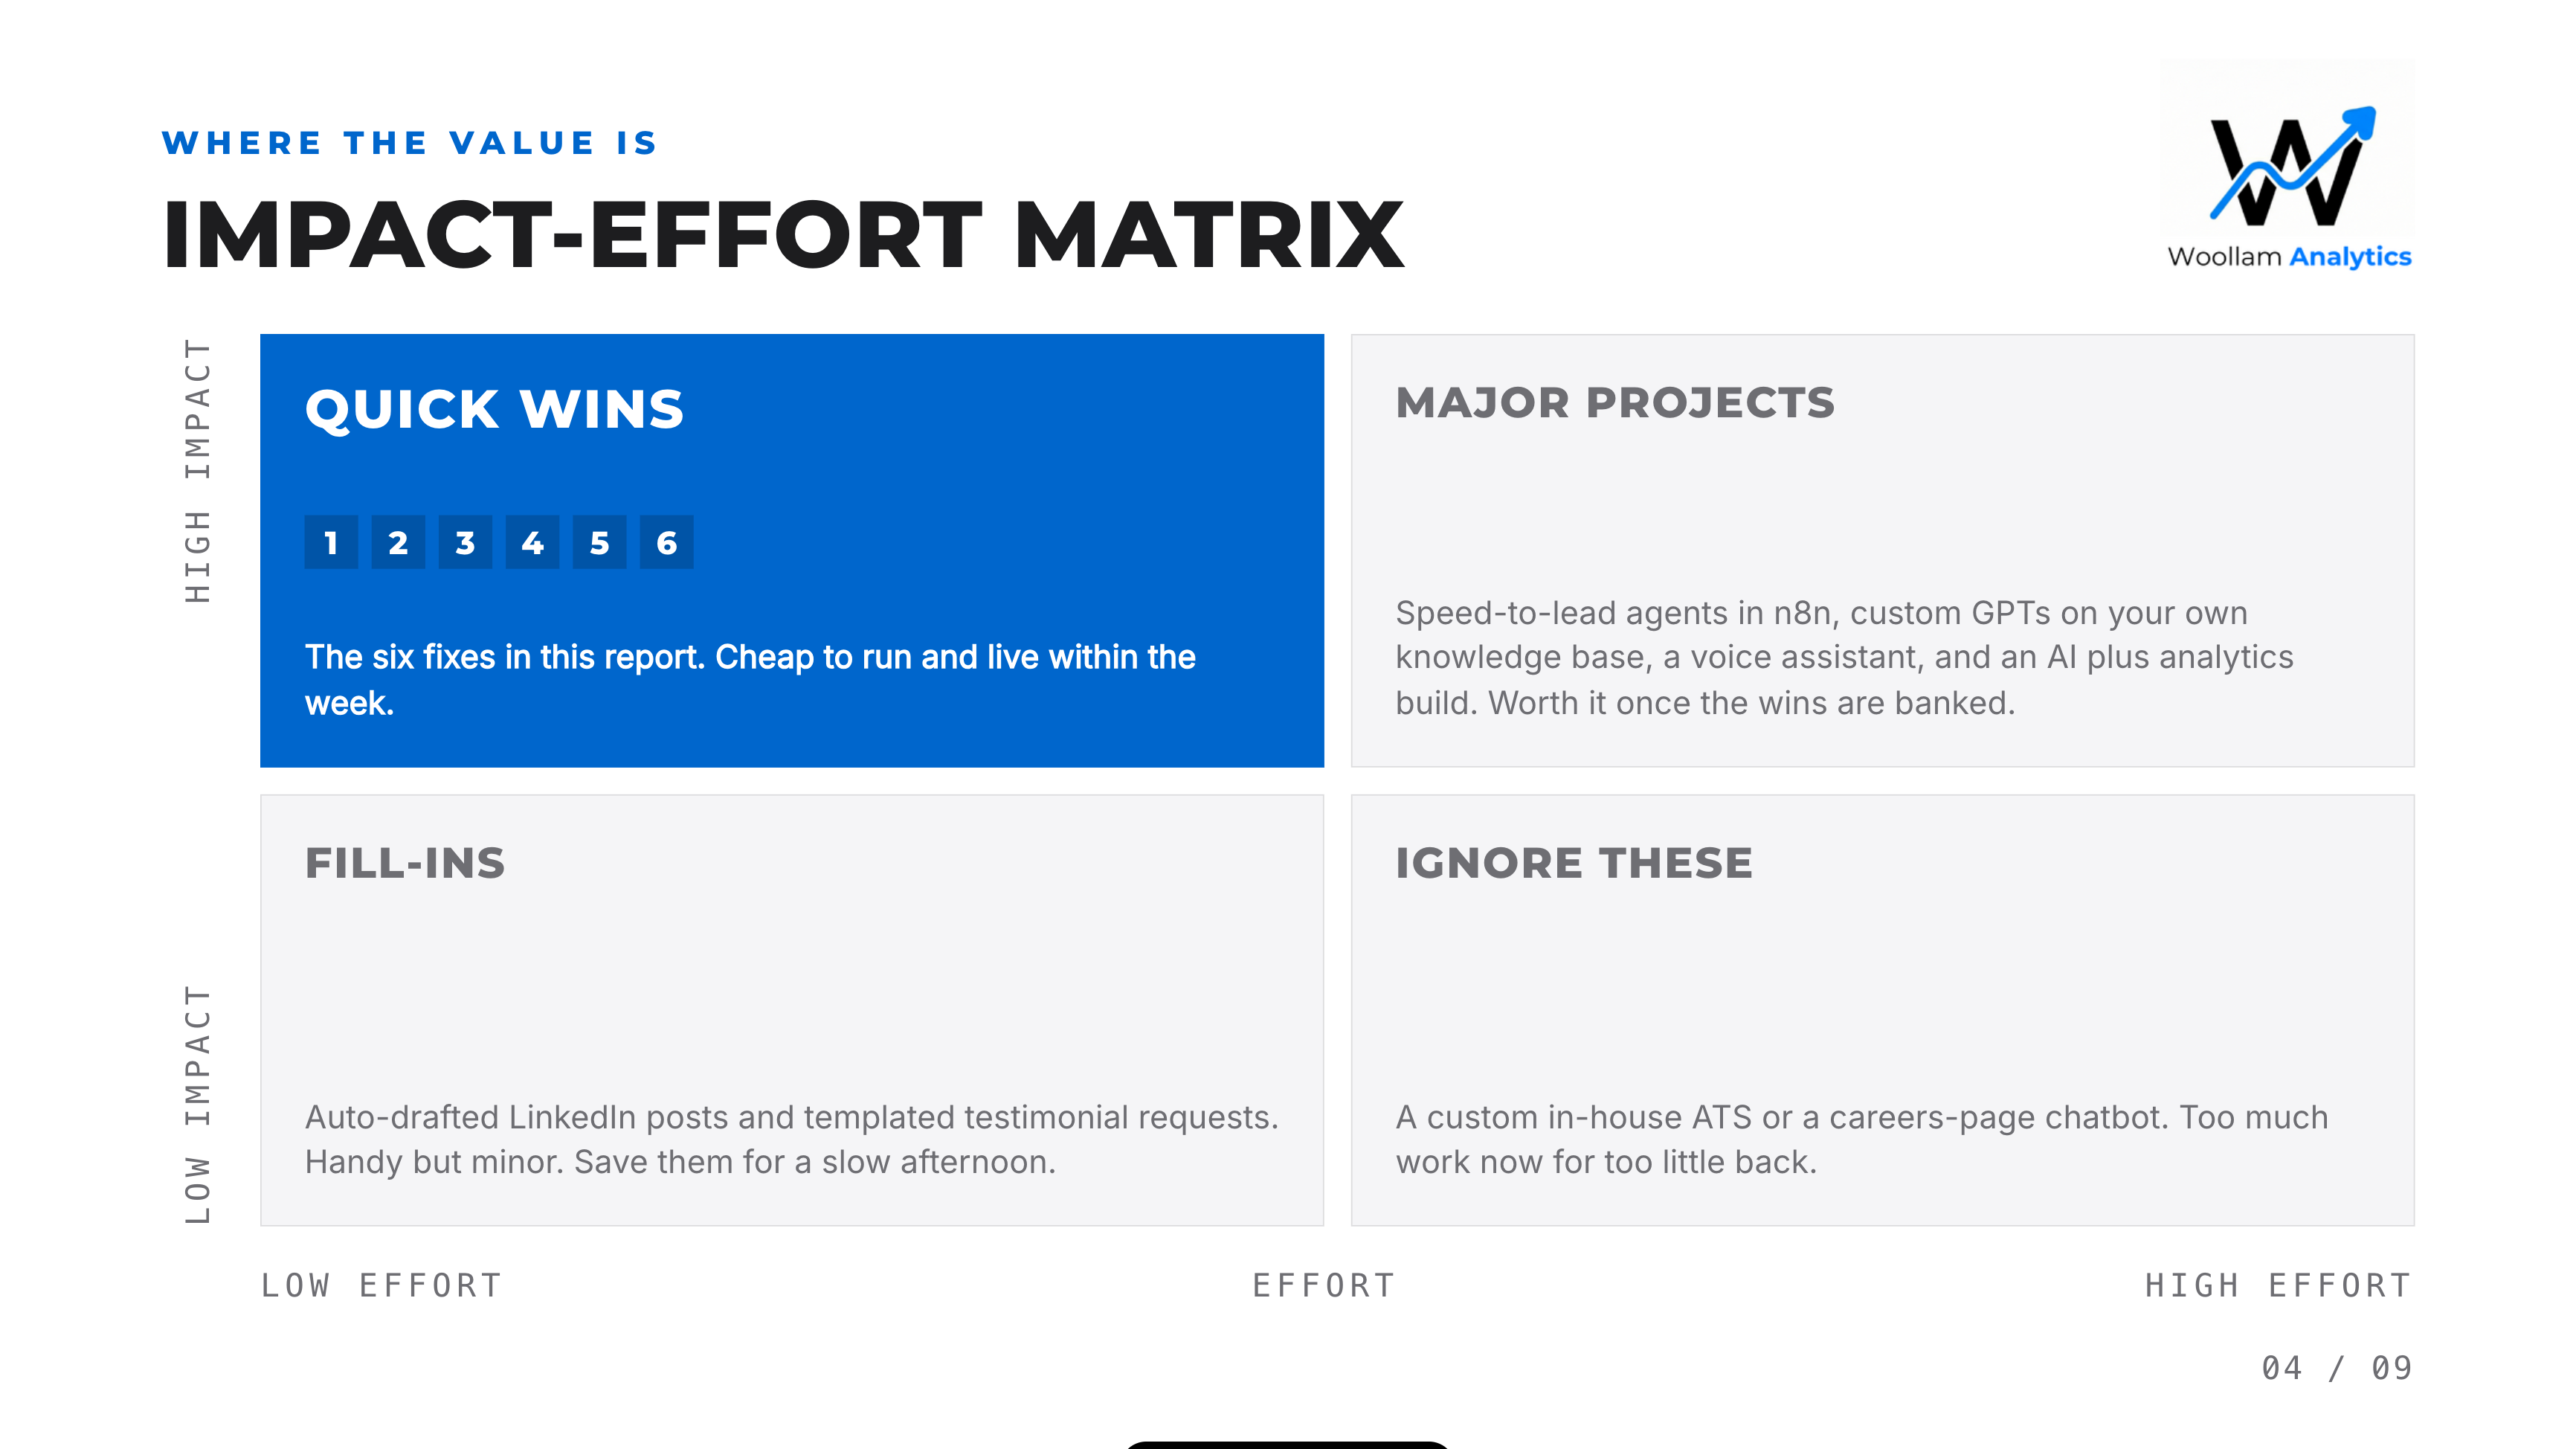
Impact vs effort matrix
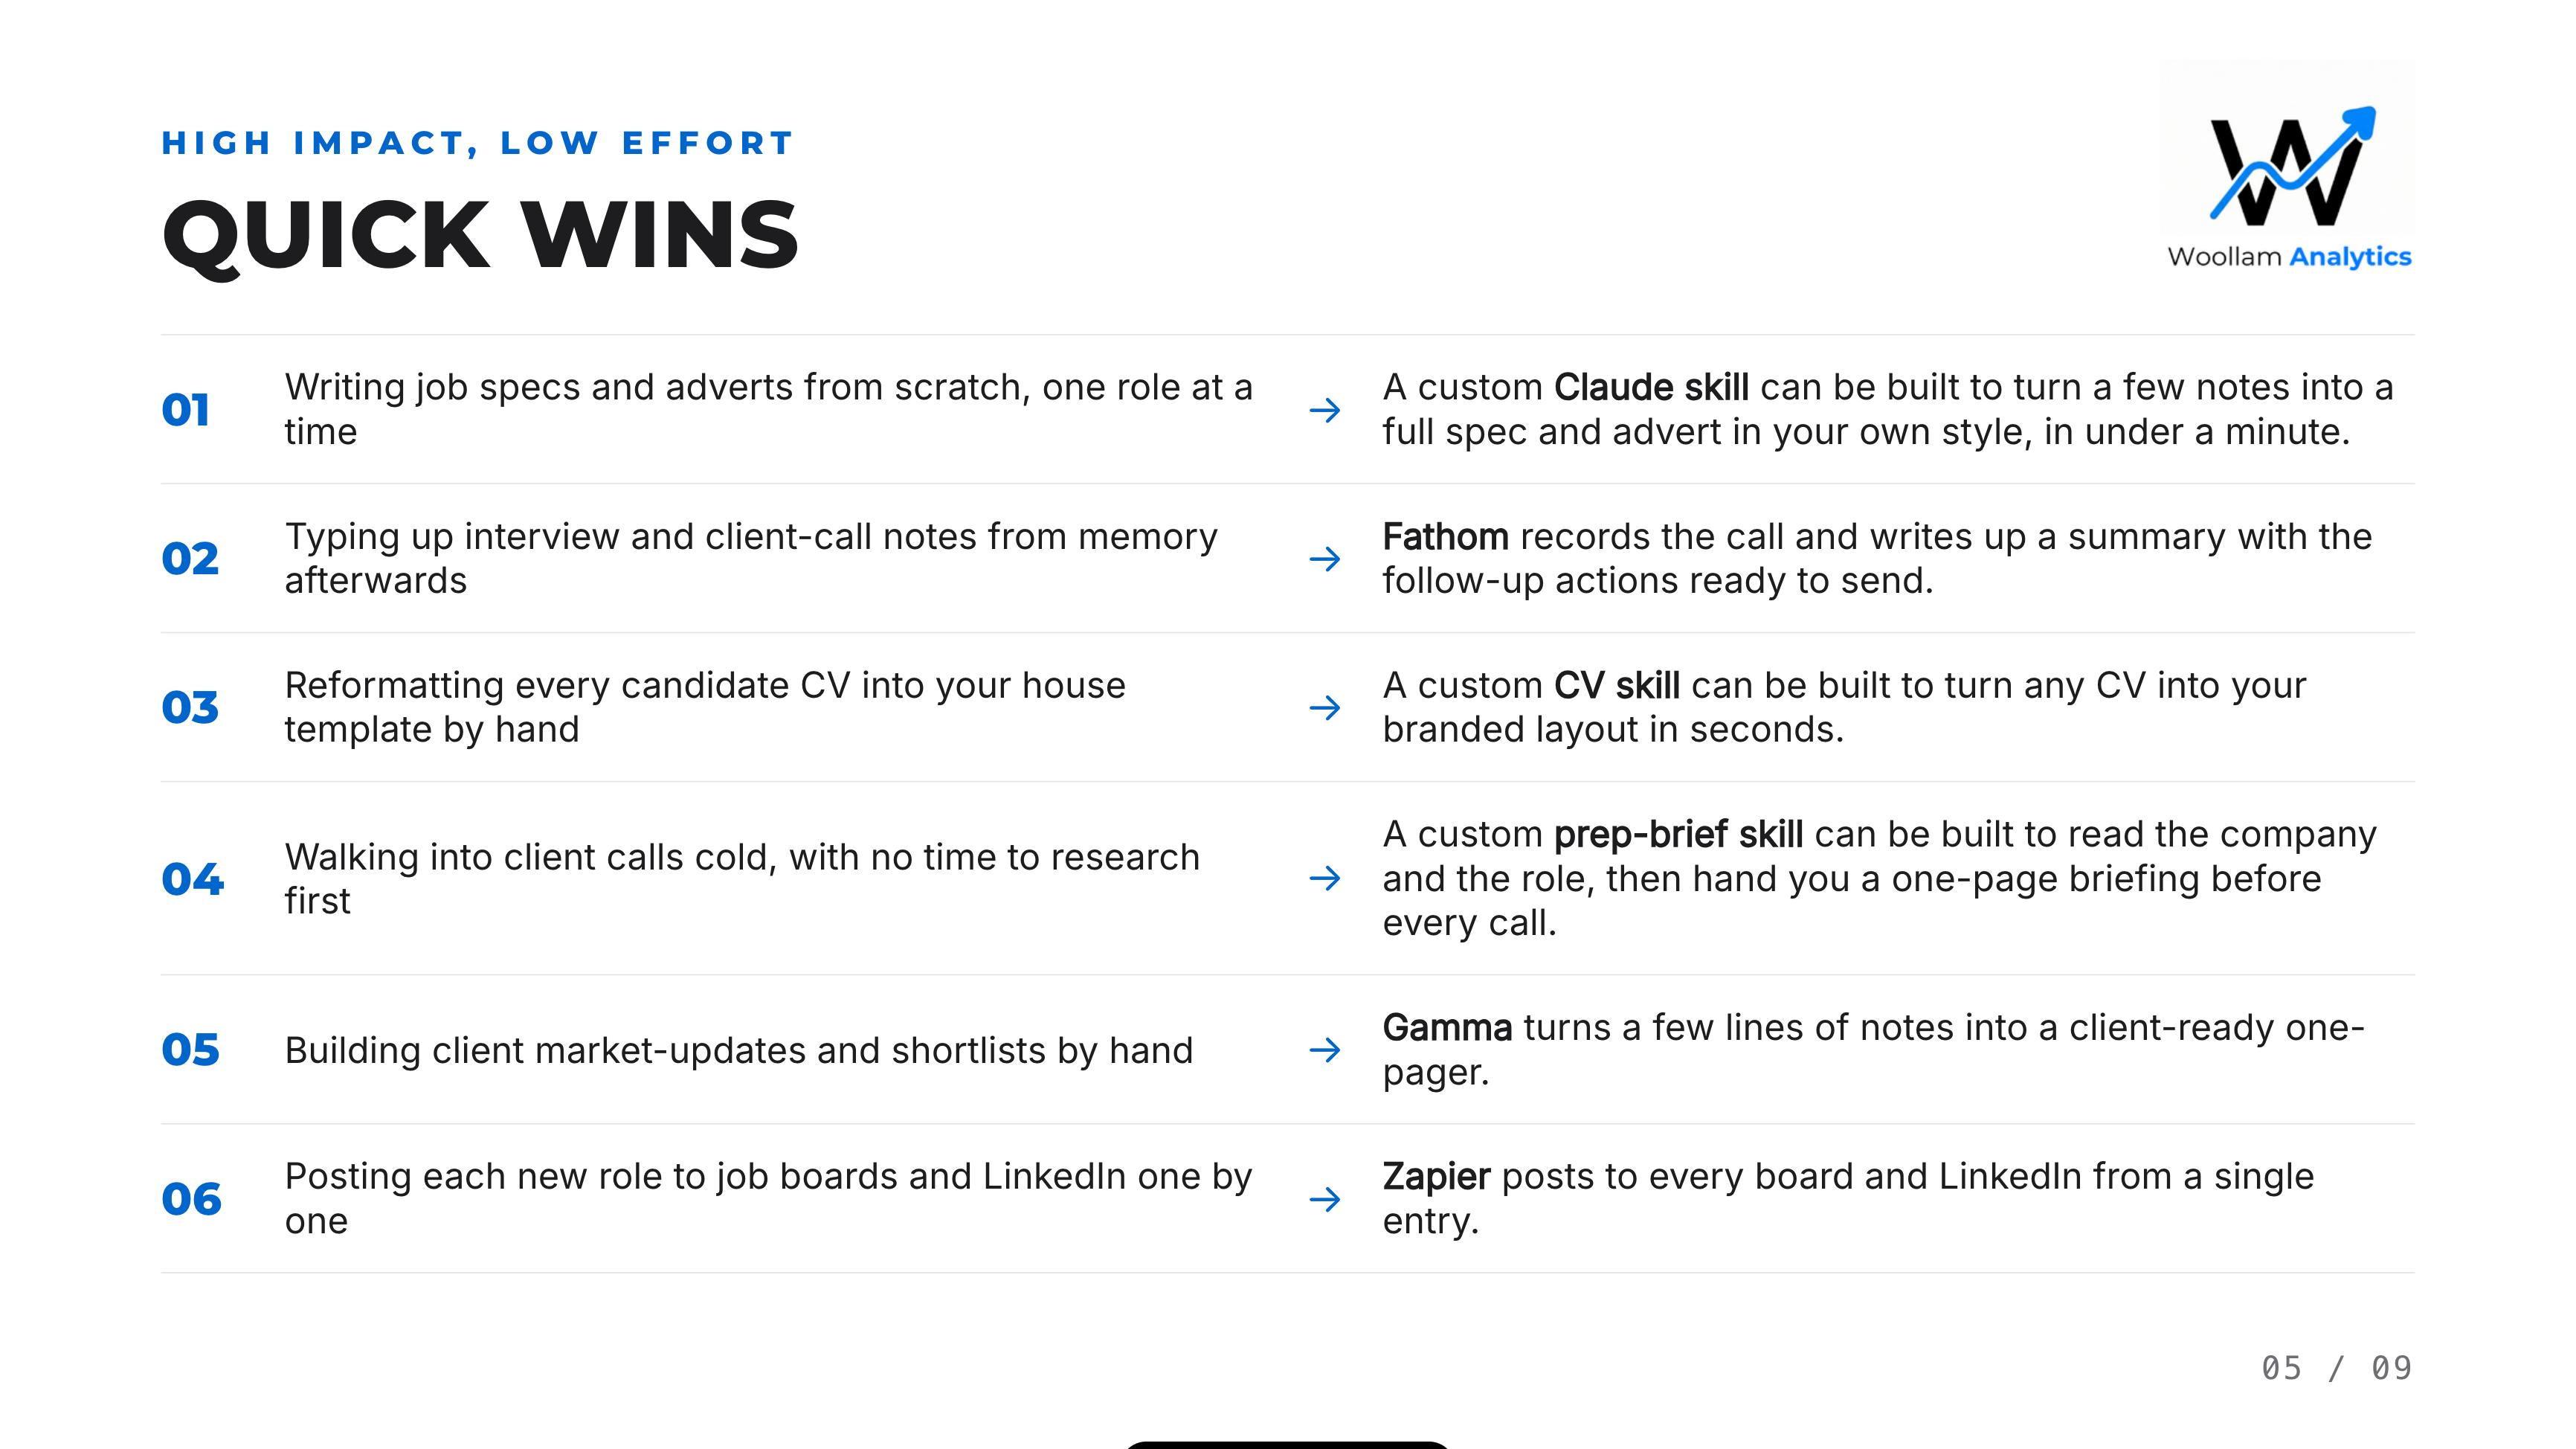
Quick wins
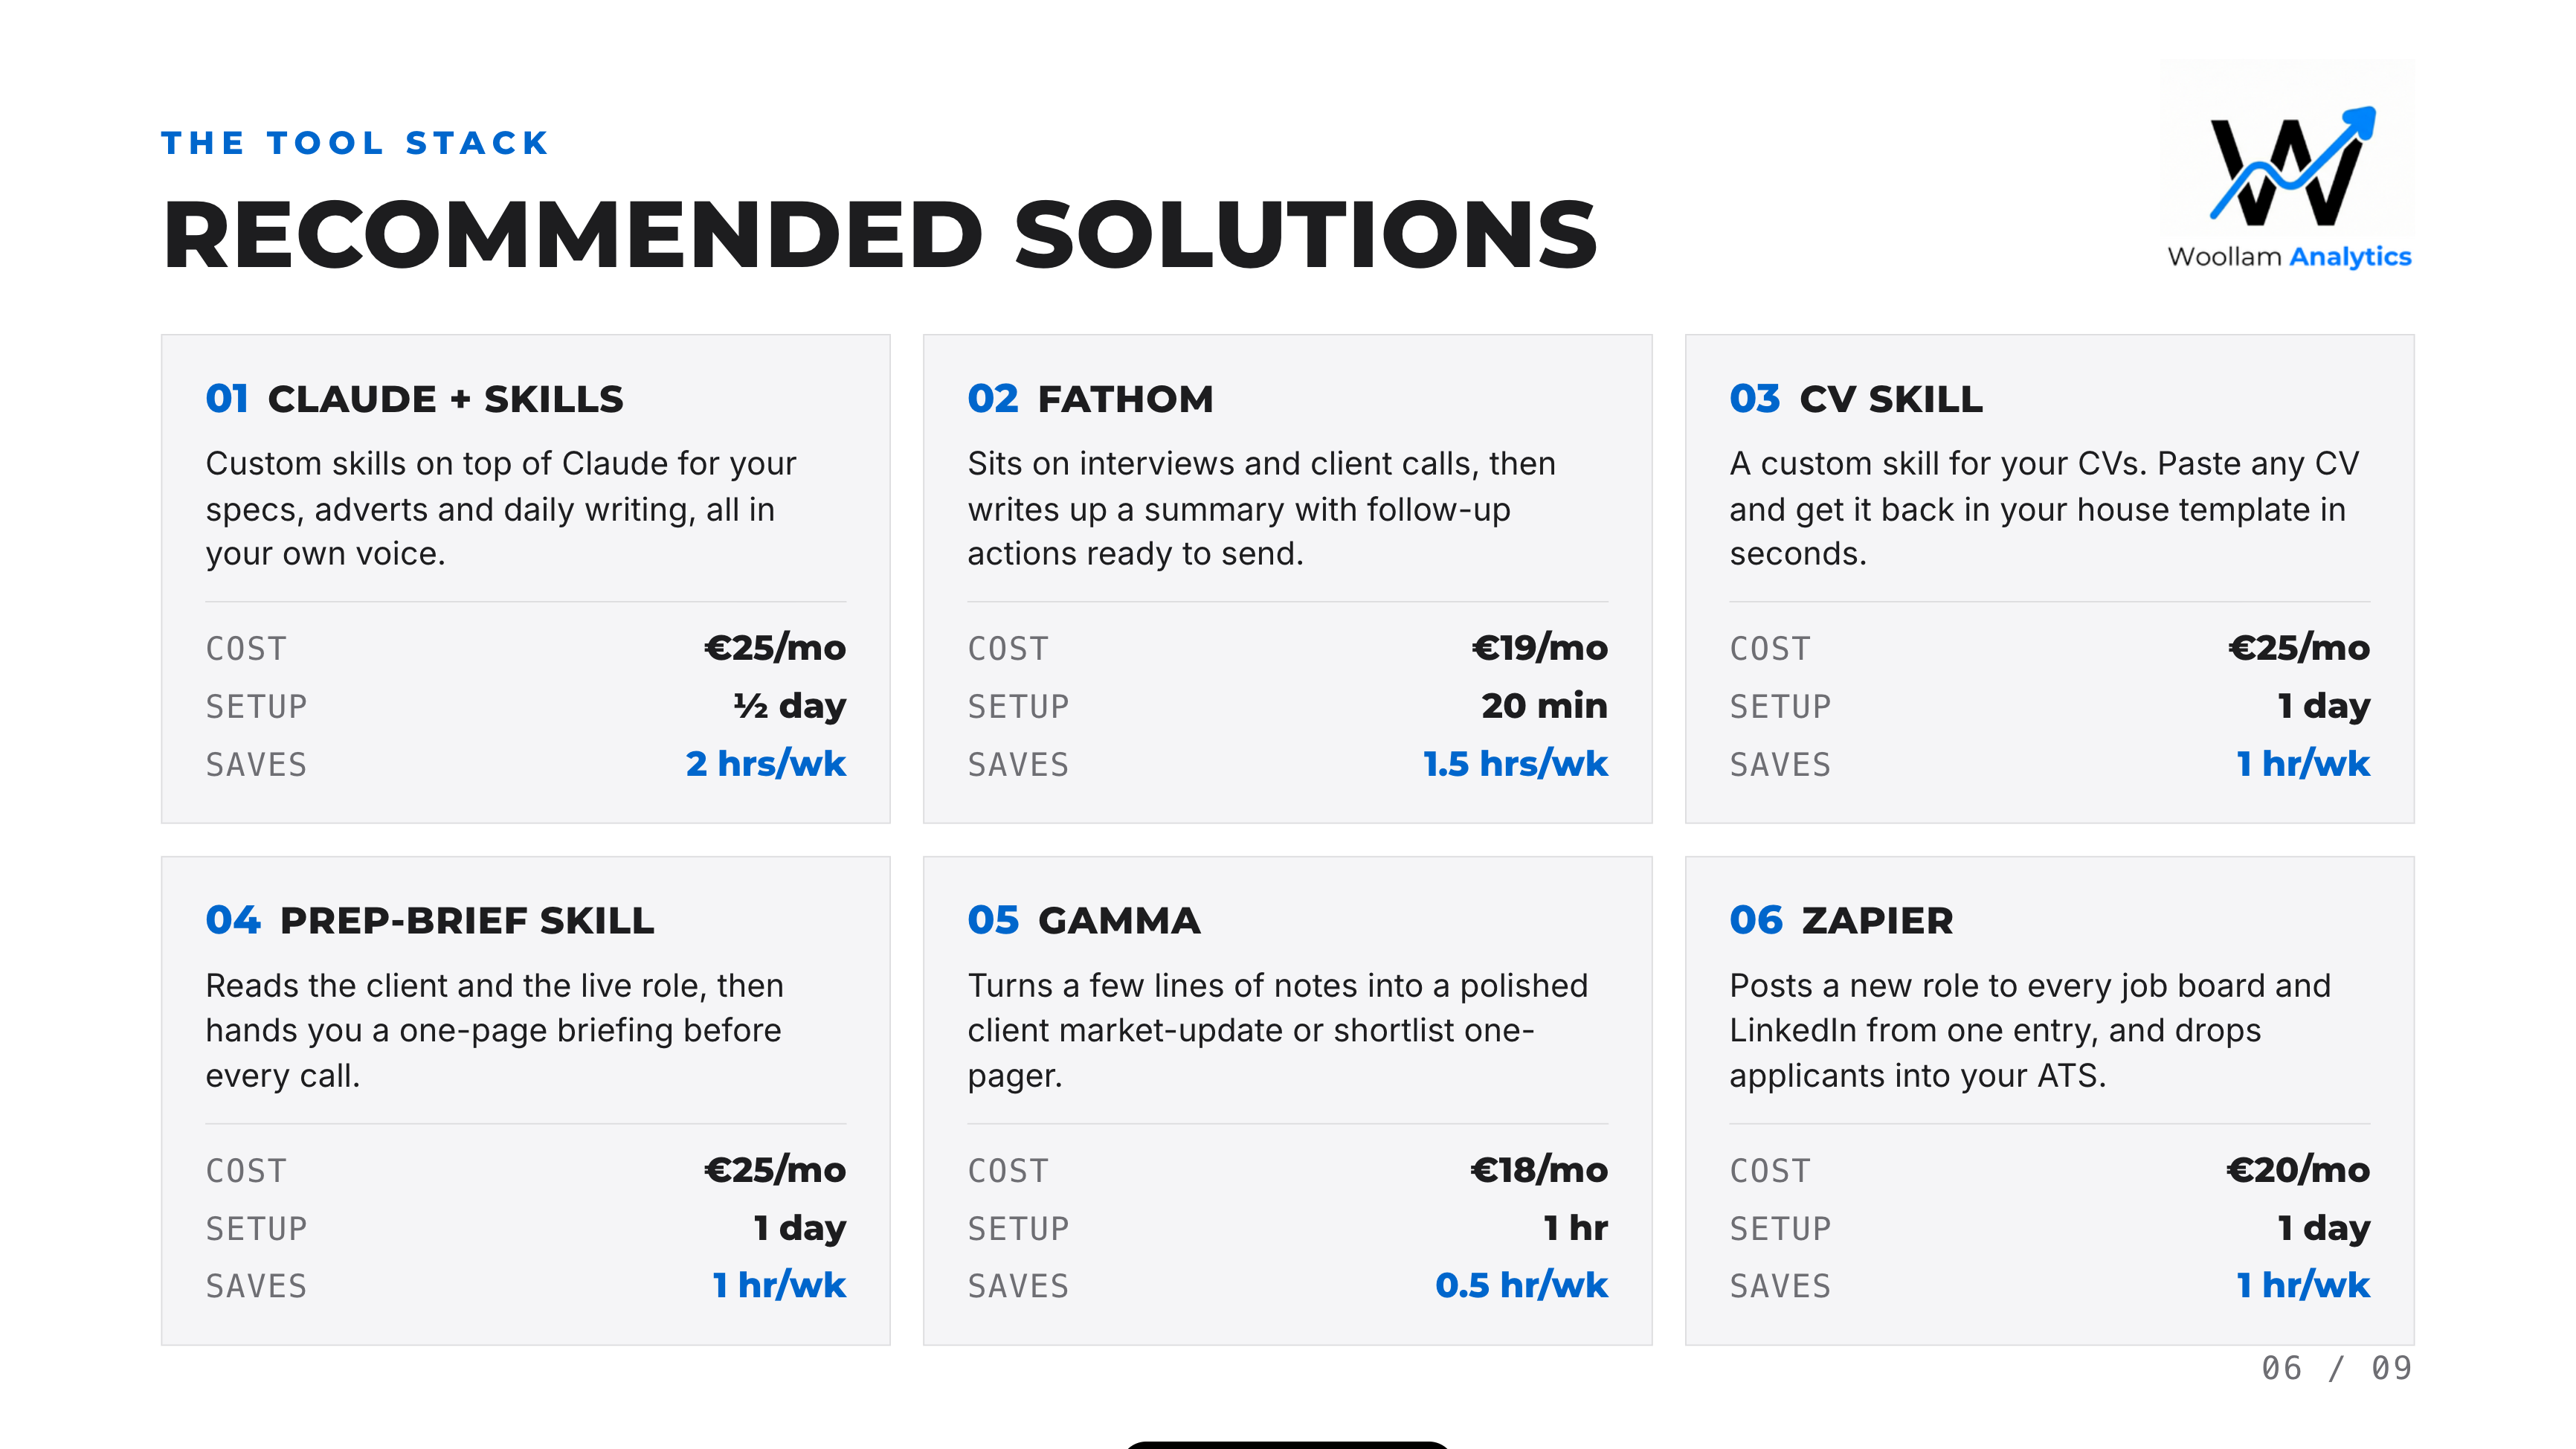
Recommended solutions
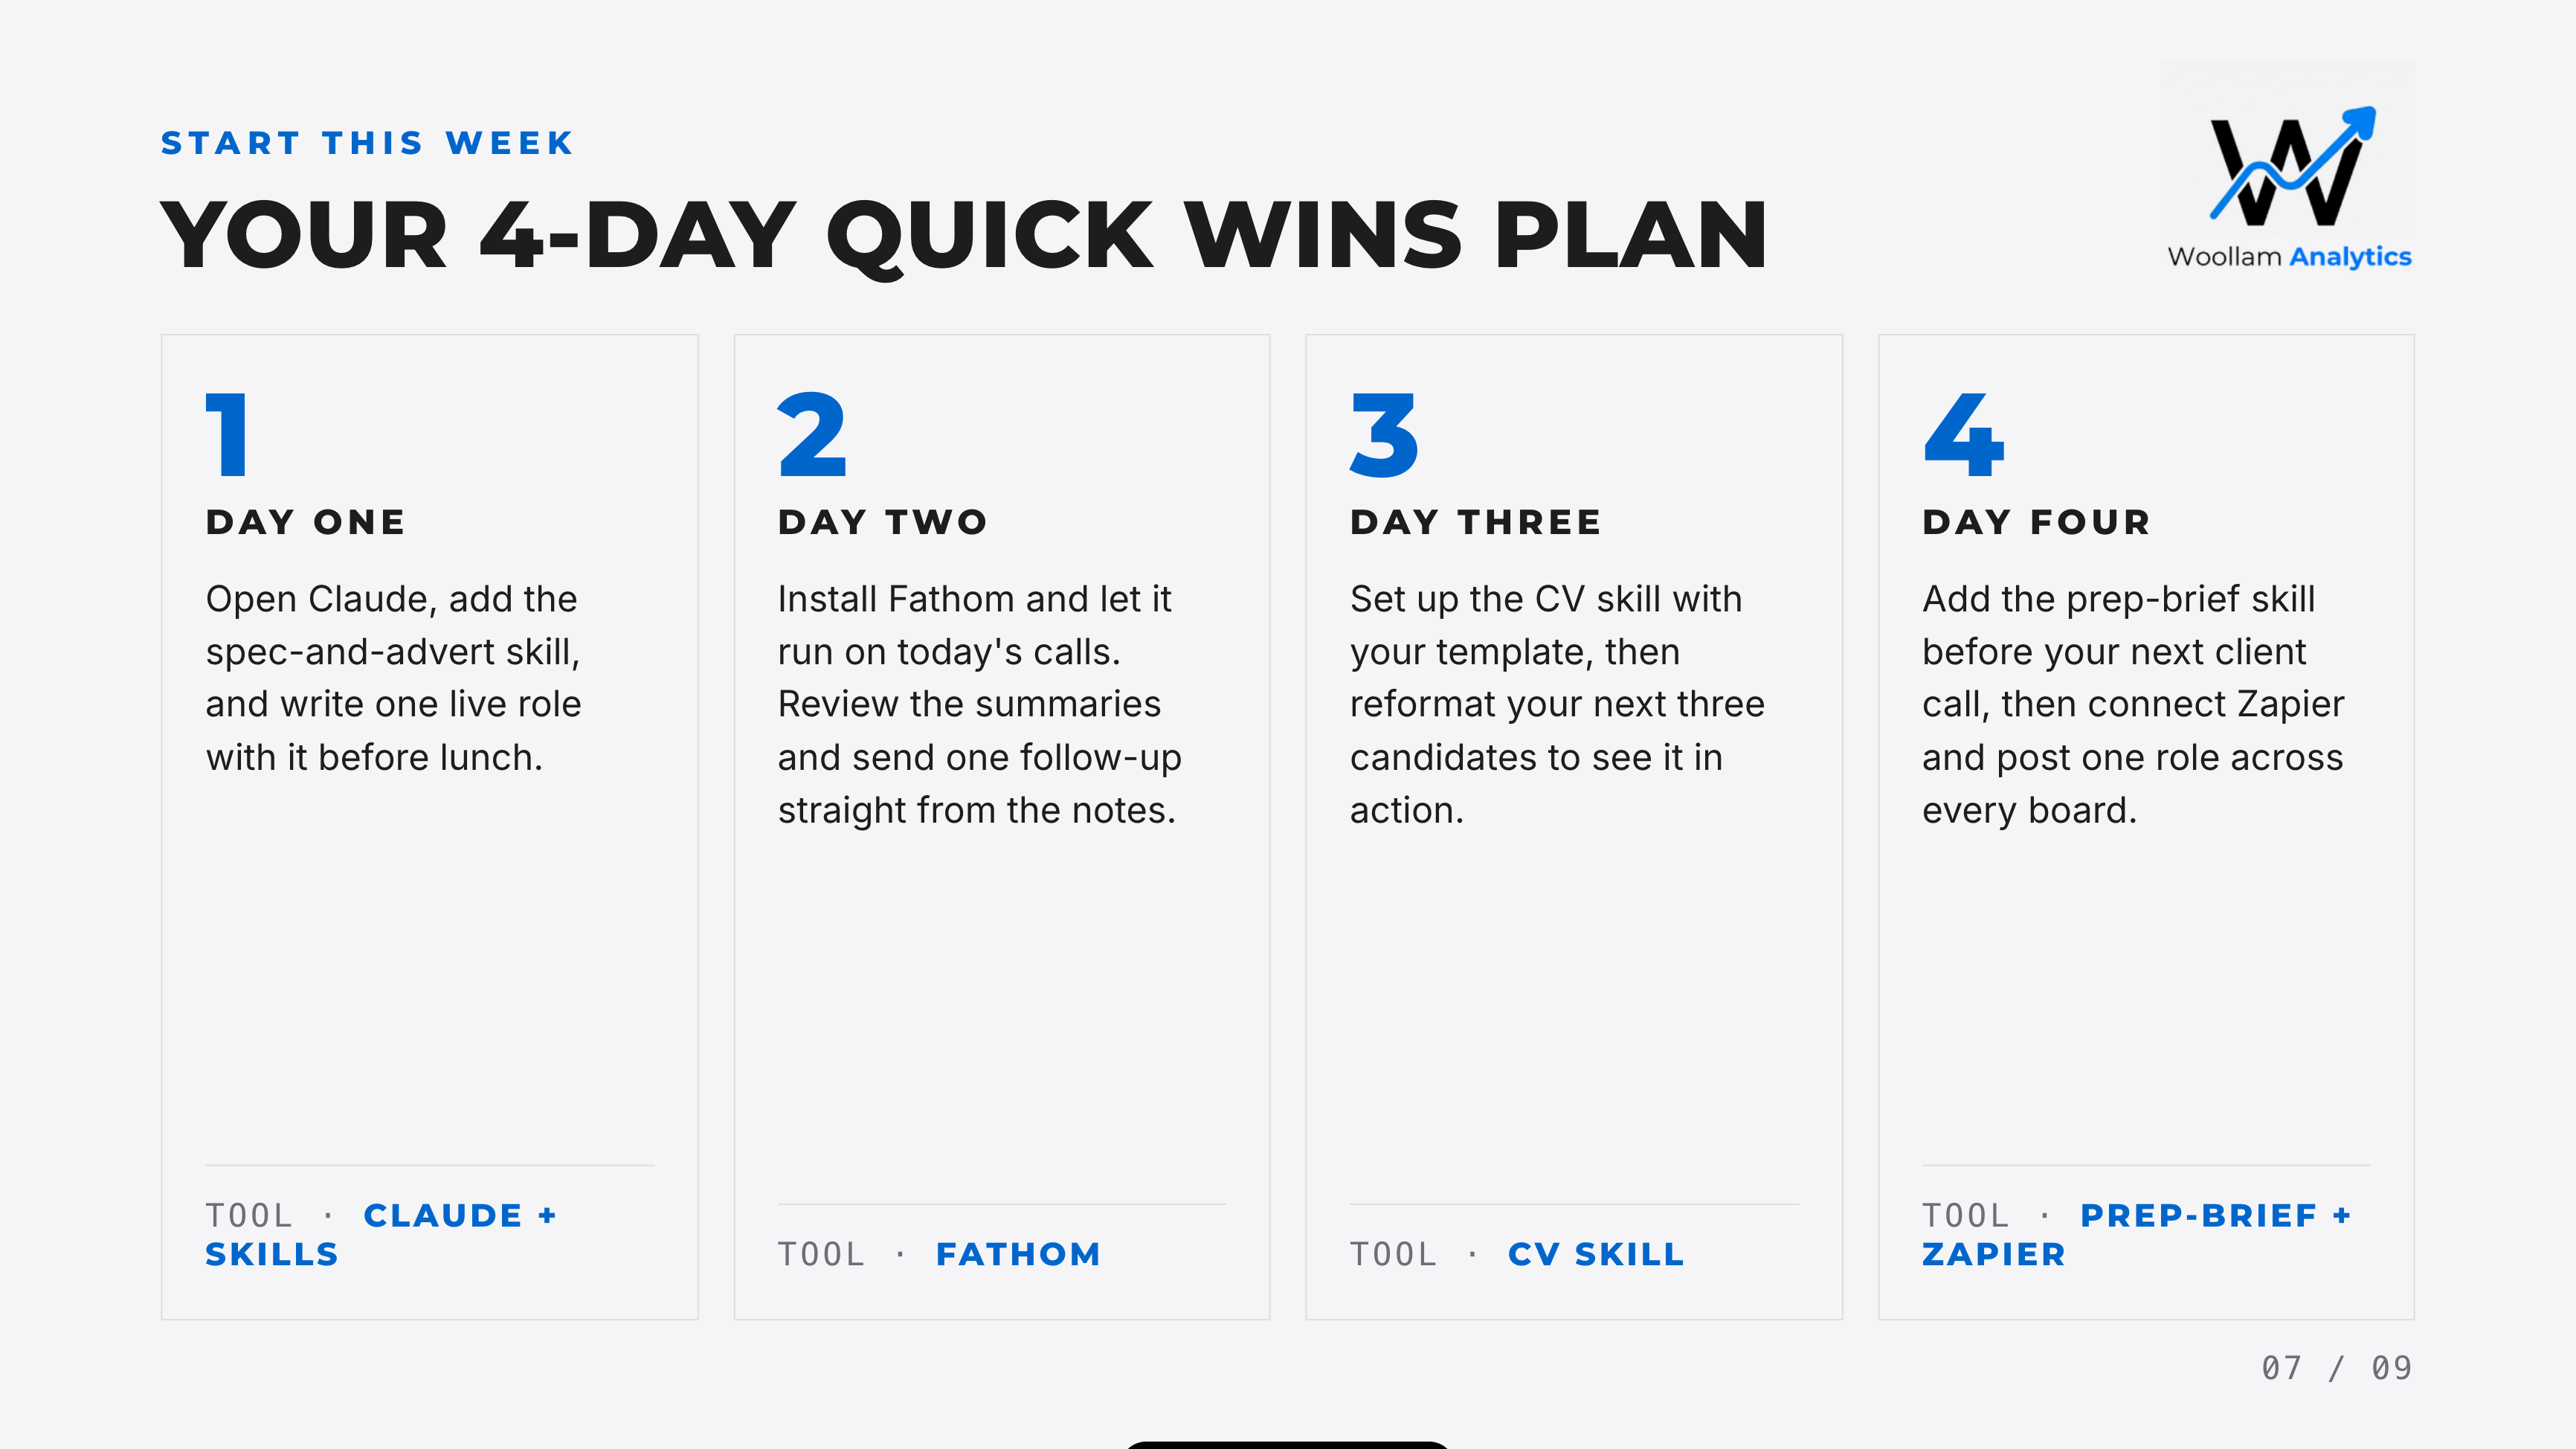
Your 4-day quick-start plan
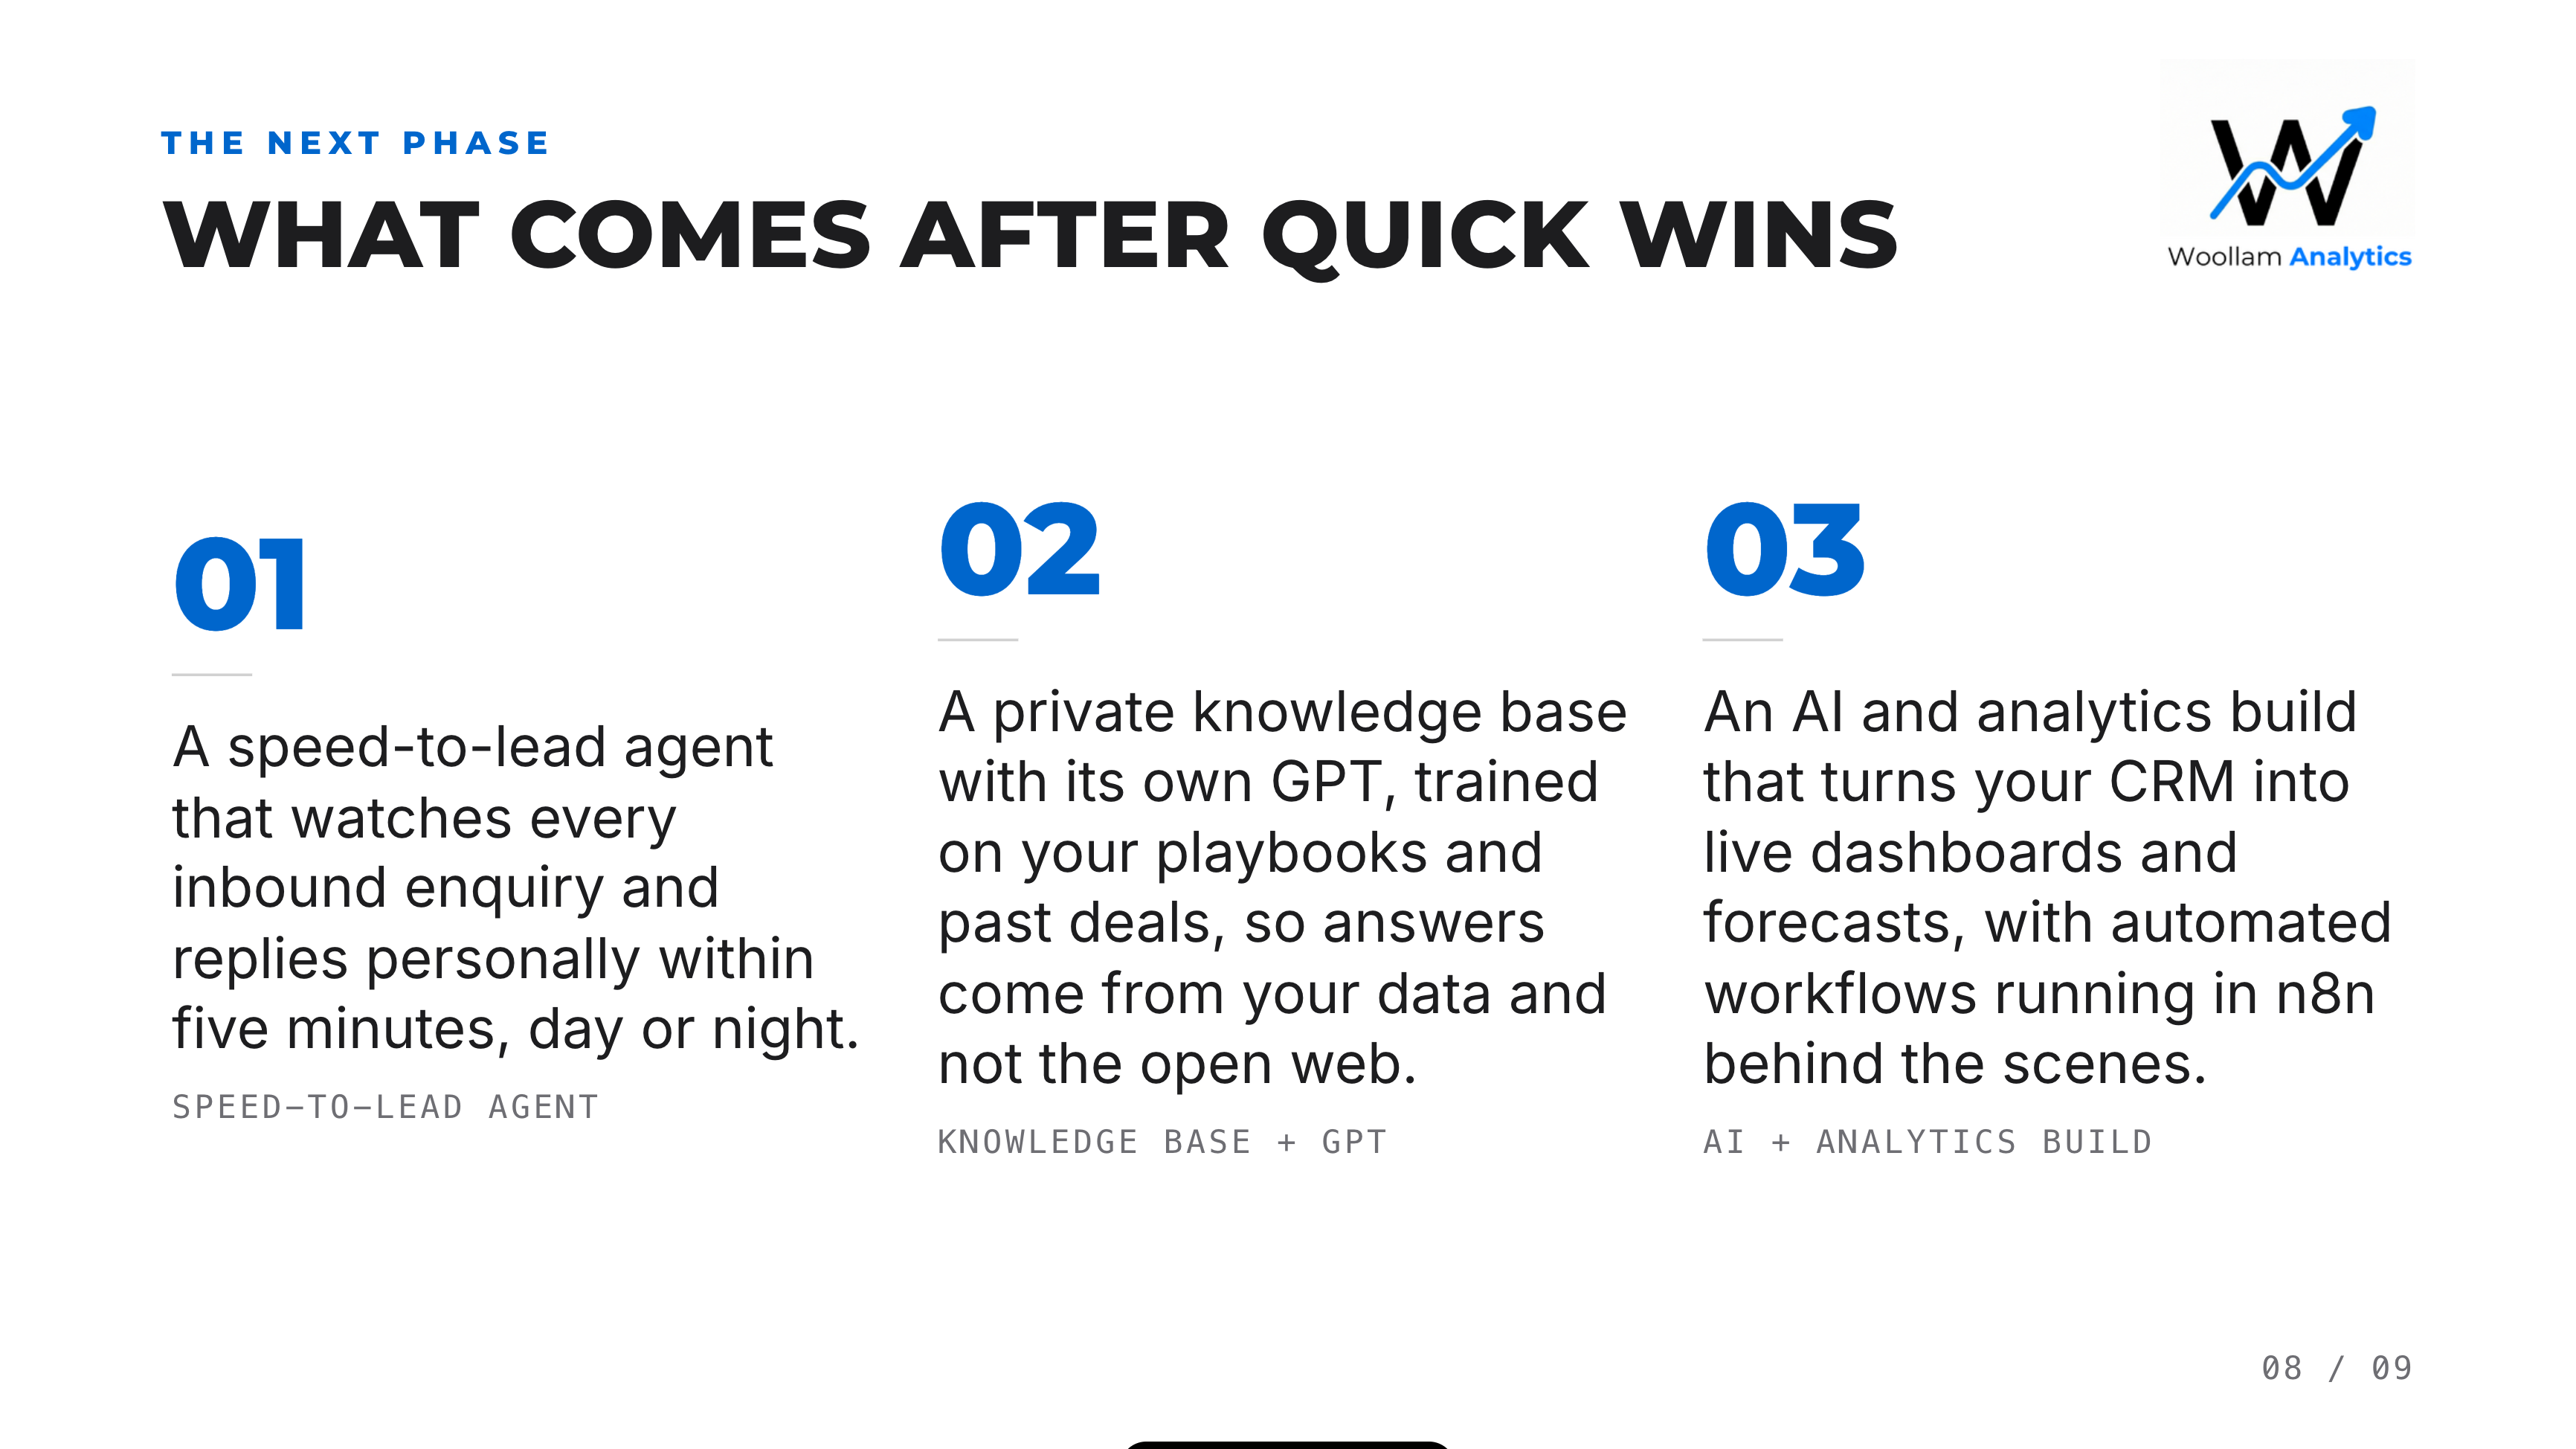
What comes after
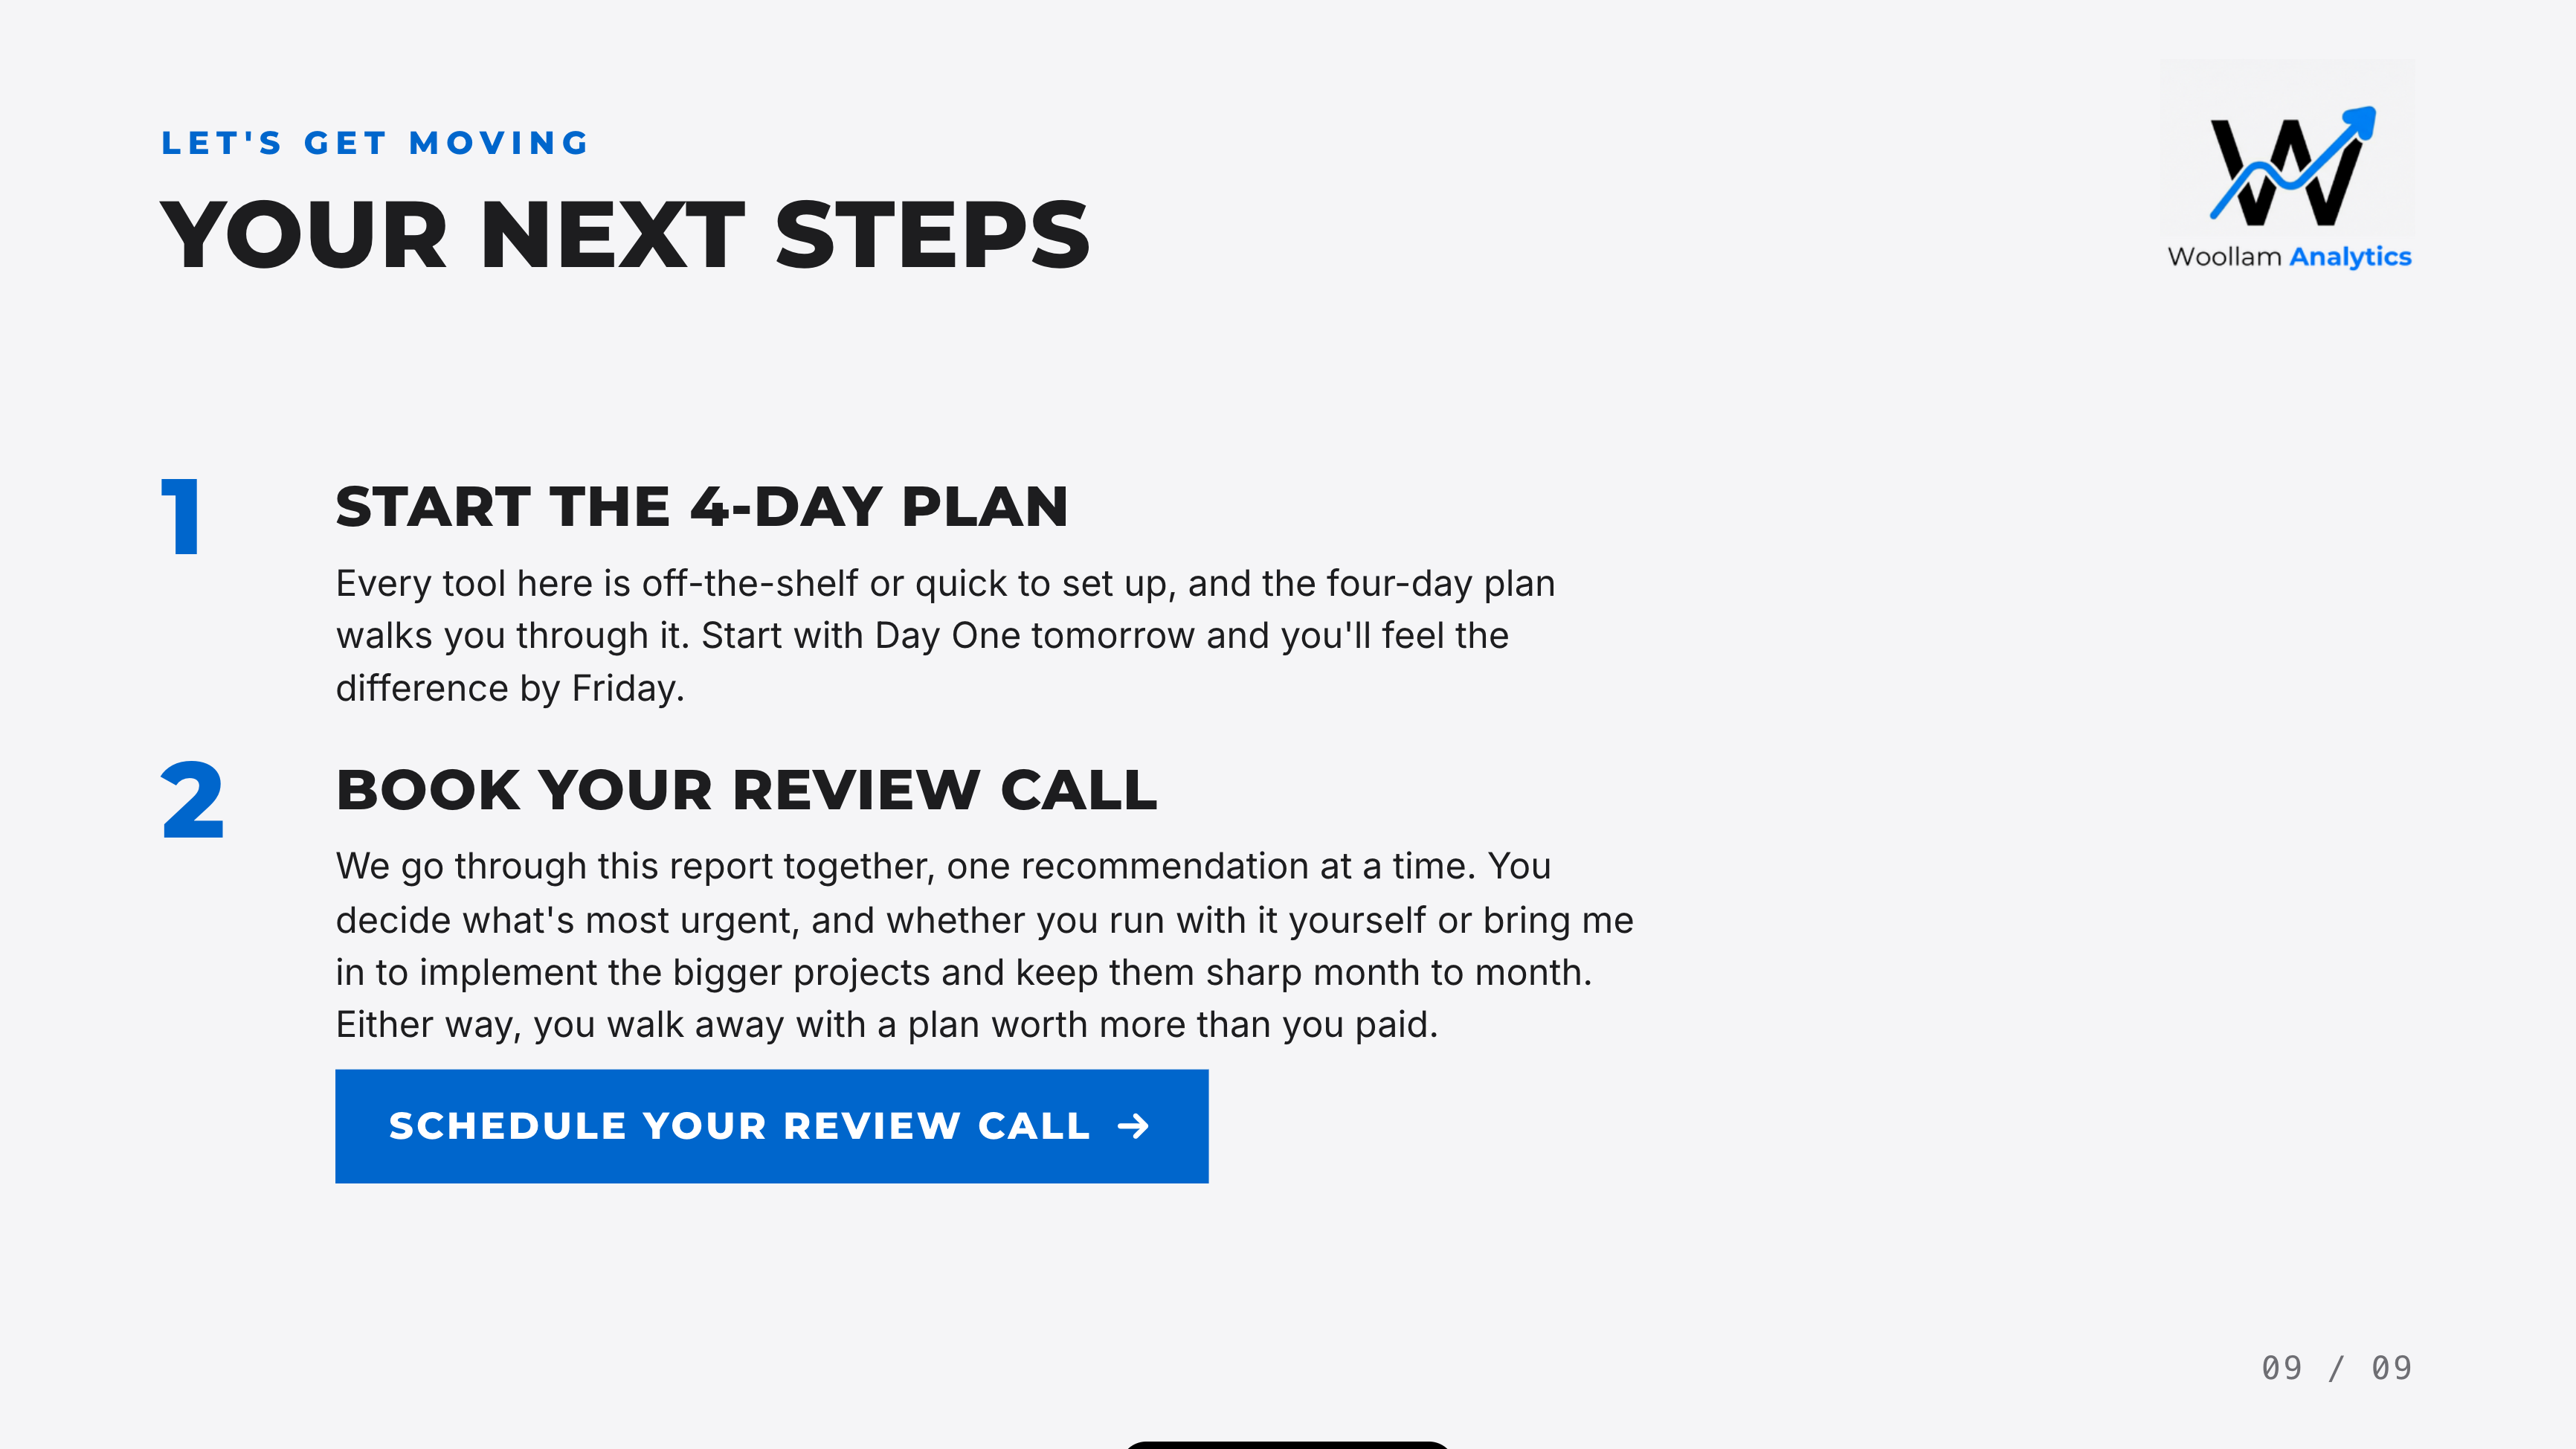
Your next steps
Done for you, from €1,500. Your €500 assessment fee comes off the price.
Want it done rather than done-yourself? I build the automations, knowledge systems and custom workflows on your real work, test them, and train your team to run them. Your €500 comes off the price.
The frameworks above are the shape most builds take. The assessment tells you which one fits, and most clients start with just one.
Senior help on tap, €999 a month. Two working calls, capped roster.
The first win is rarely the last. The concierge keeps it going: an intake questionnaire that finds the wins before we even talk, two working calls a month where we build live, always-on access between sessions, and a running record of everything we ship. Senior help every month, without a hire.
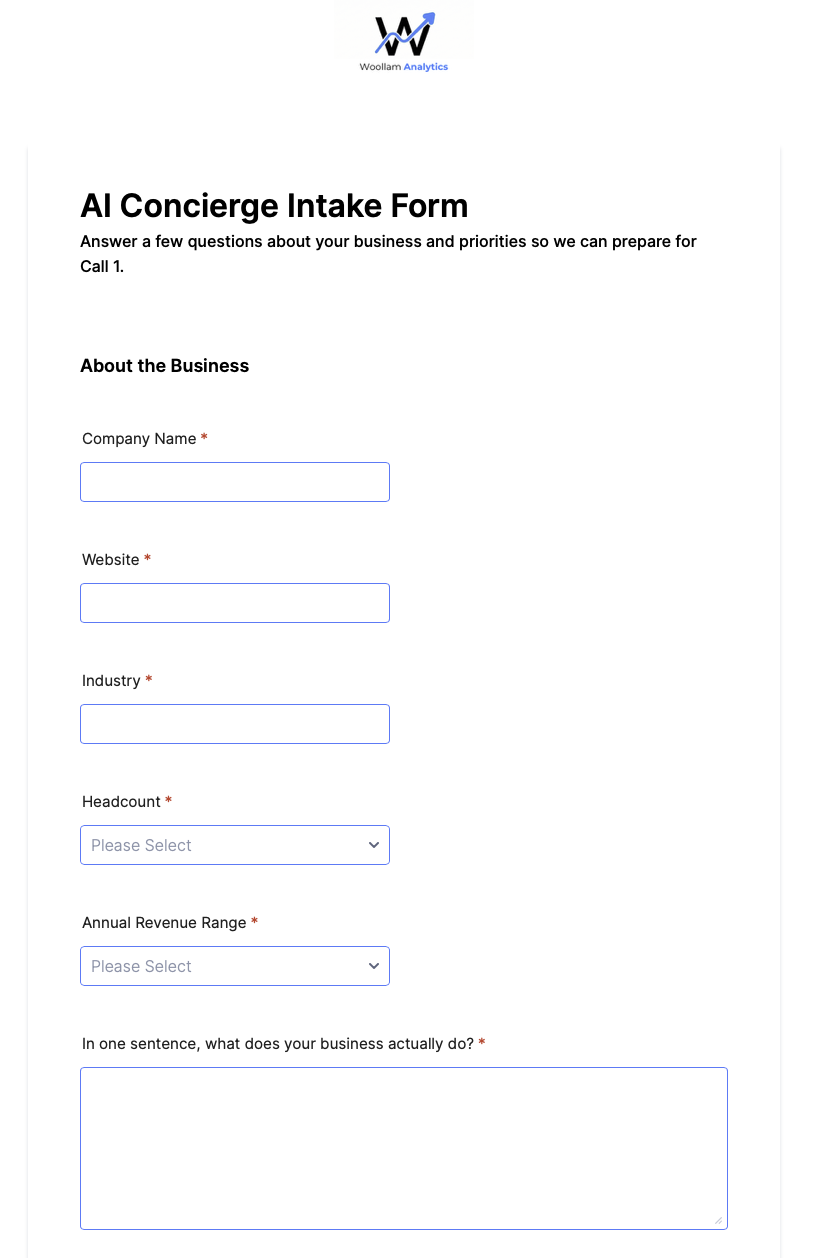
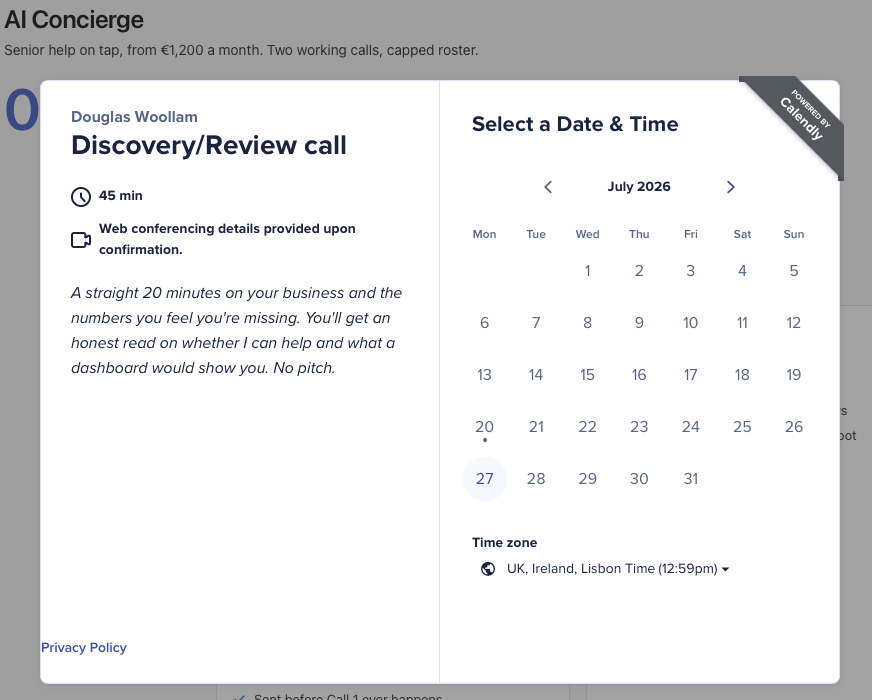
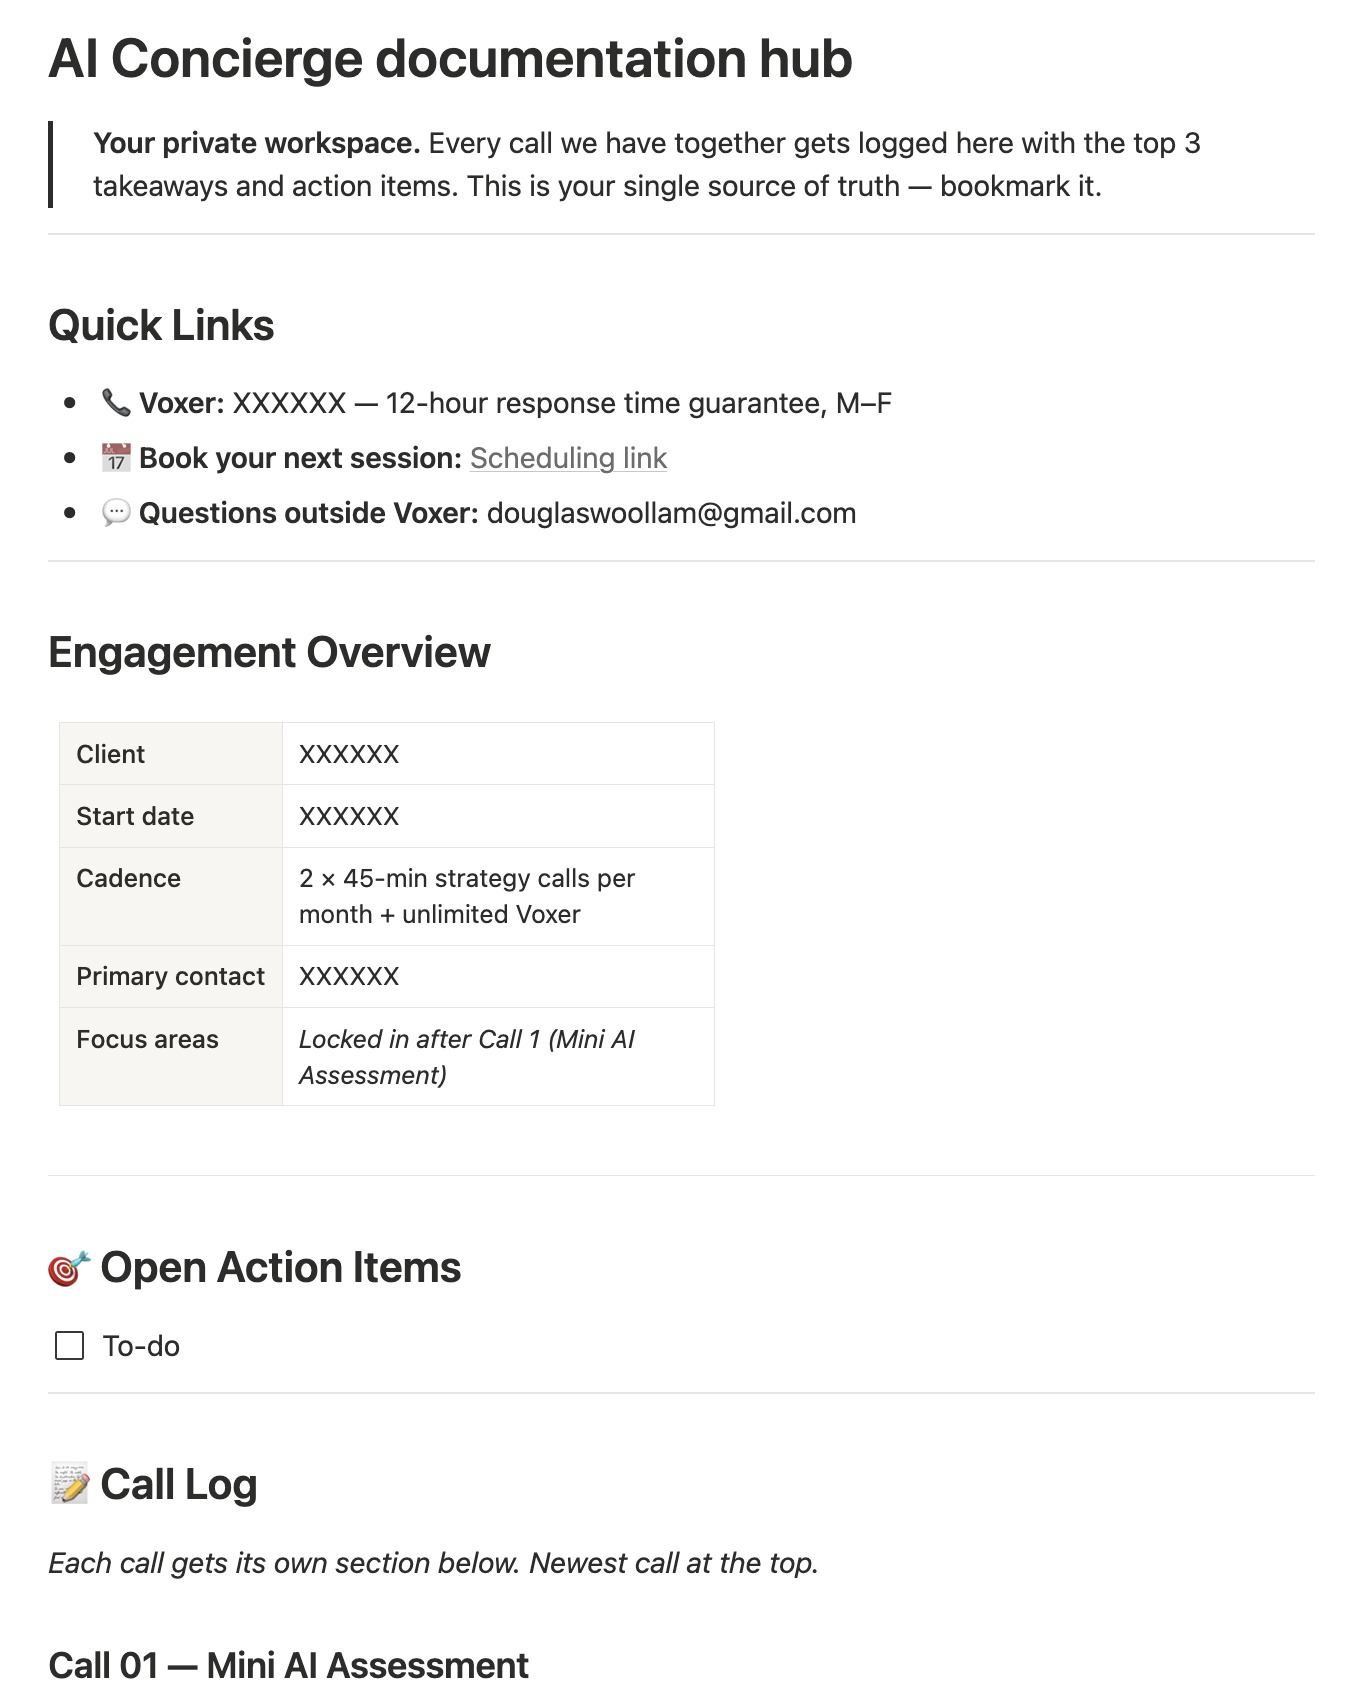
It all starts with the assessment. Book the assessment
Then you get every cent back. The guarantee is simple: if the assessment doesn't find you at least five hours a week of opportunity, you pay nothing. All you've risked is a 45-minute call.
No. You talk about your business the way you'd explain it to a friend. The technical part is my job. The report is written in plain language, and if you choose implementation, I set everything up and train your team.
Usually yes. A chat window is a tiny slice of what's out there. The assessment looks at your actual workflows and finds the specific tools and automations that do the repetitive work for you, which is where the real hours come back.
The €500 assessment recommends and shows you how, with a 4-day plan you can follow yourself. If you'd rather have it done, that's implementation, and your assessment fee comes off the price. Plenty of clients do the quick wins themselves and hire me for the bigger builds.
Fast. The report ends with a 4-day quick start, one small action a day, so most clients have something working within the first week or two. The bigger automations take longer, but the early wins usually pay for the assessment on their own.
A course leaves you to do the work. An agency hands you juniors. You get one senior practitioner who has shipped agentic AI in a large enterprise, applying that to your business. You work directly with the person doing the thinking.
No lock-in. The concierge is €999 a month, month-to-month — cancel any time. The only limit is spots: it runs on a capped roster so everyone gets senior attention, so a place isn't always open.
Book the €500 assessment, or tell me a bit about your business first and I'll let you know honestly whether it's a fit.
€500, credited in full if you go on to a build. If I can't find you at least five hours a week, you pay nothing.
A free monthly meetup for owner-run businesses across Cork. No jargon, no sales pitch. Just the practical AI tools that cut the admin eating your week, shown working on real business tasks.
The next date and venue are being confirmed. Reserve your seat now and we’ll email you the details first.
Every month we pick one thing and do it well. You watch it work on the kind of tasks that fill your own week, then take it home.
The short list of AI tools actually worth using, each one shown doing a real job. Not fifty tabs to go and test on your own time.
One practical workflow you can put to work the very next morning, set up in front of you, step by step.
A room of Cork owners solving the same problems you are. The conversation after the talk is where the good stuff happens.
Same shape every month, so you always know what you’re walking into.
Around twenty minutes on one useful thing, usually how to actually use Claude, shown live on a real business task.
Bring your biggest weekly time-sink. We talk through the tool that handles it, together, in plain language.
The room stays on for a while afterwards. Meet other local owners over the practical stuff you just saw. Bring a laptop for hands-on help with something of your own.
Reserve a seat and you’ll be first to hear the date and venue, and first in line for one of the early spots.
On our paid work we guarantee 5+ hours a week saved, or your money back. The meetup is where we show a slice of that, for free.

Douglas Woollam
Data & AI Consultant
Douglas has shipped agentic AI inside a large enterprise and now helps Cork businesses put the same tools to work. He runs the AI Tools Assessment behind woollamanalytics.com.
LinkedInMurilo Reis
Data & AI Consultant
Murilo is a local data and AI consultant who helps businesses turn everyday tools into time back in the week. He co-hosts the meetup and works the room afterwards.
Yes. The meetup costs nothing to attend. We run it to meet local owners and show what these tools can actually do. If you later want a one-to-one look at your own business, that’s our paid work, and it’s completely optional.
Not at all. If you can use email, you’re fine. We keep everything in plain language and show things working rather than talking theory.
No pitch from the stage. We show useful tools and answer your questions. If you want to take it further afterwards you’re welcome to ask us, but nobody is getting sold to.
Owner-run businesses across Cork. Clinics, trades, shops, firms and agencies are all welcome. Bring your biggest weekly time-sink and leave with the tool that handles it.
Just yourself and one task that eats your week. Bring a laptop if you’d like hands-on help setting something up for your own business.
Once a month in Cork, same simple format each time. Reserve a seat and we’ll tell you the date and venue for the next one first.
Free to attend, limited seats, and no sales pitch. Reserve now and we’ll send you the date and venue the moment they’re set.
Free · Limited seats · Monthly in Cork
Would rather a one-to-one look at your business first? See the AI Tools Assessment.
Made for Apple in my role as a Data Analyst. Created with artificial data.

Awarded to <0.01% of published vizzes by Tableau's editorial team.
Hover, filter and switch tabs.
Featured by Tableau's official account on LinkedIn.
Christmas is a major time for sales around the world, and making the most of the holiday rush can be a bit challenging. In this task, I helped Apple analyse Christmas data to uncover insights into customer behaviors during the festive season. The dataset provided includes anonymized Christmas sales data across various product categories, customer demographics, and marketing campaigns.
Here are my key takeaways
Children (ages 1–11) contributed nearly 40% of total Christmas sales, with Smartphones and in-store shopping being their top preferences.
The top 5 best-selling products, all for children, declined by up to 15% over four years — highlighting changing consumer trends.
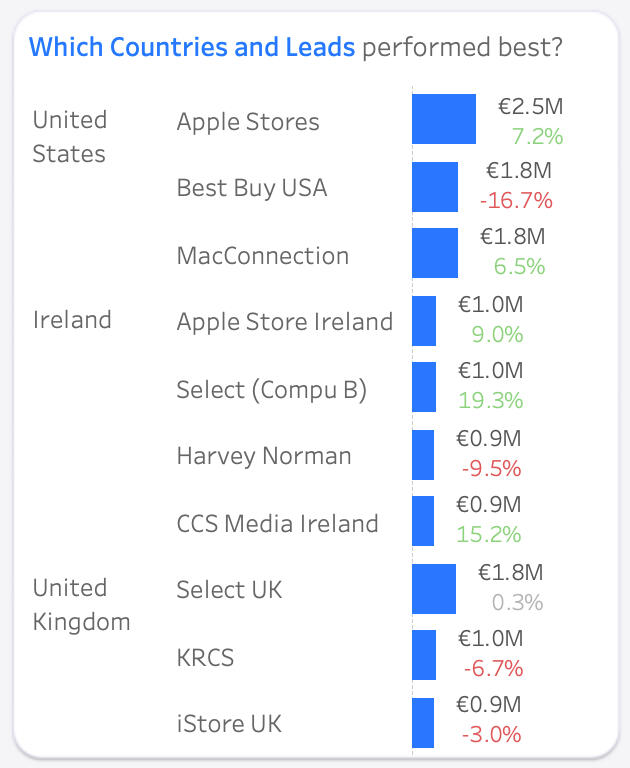
United States led with €6.2M in sales and US Apple Stores leading with €2.5M in sales, while Netherlands grew 14%, and Canada declined by 12% since 2018/2019. Irish Store Select (Compu B) increased sales by 19.3%, which could be targeted for future sales leads.
Covid caused a -3.2% dip in 2020, followed by a +1.9% recovery in 2021, though sales hadn't fully rebounded.
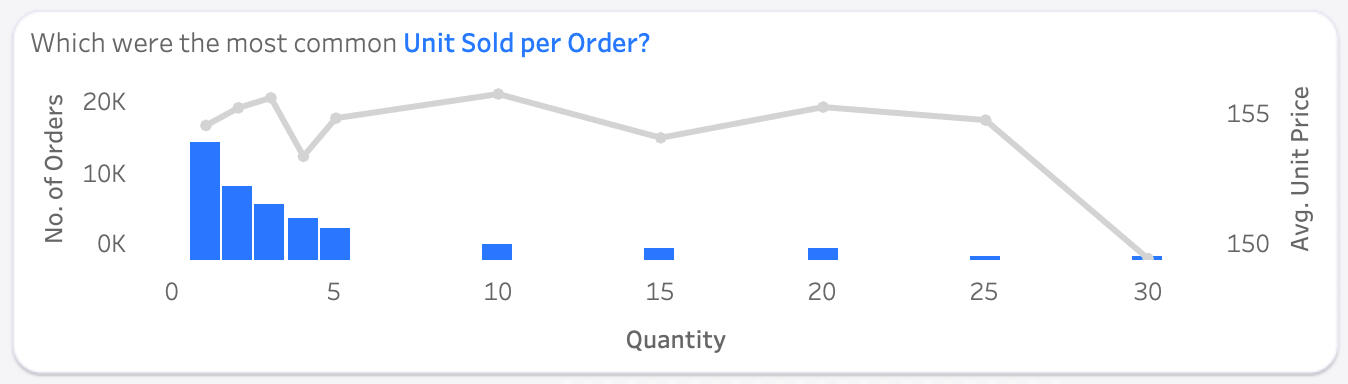
Customers tend to buy 1–5 products per transaction, but when making bulk purchases, they preferred 5, 10, 15, or even 30 items. This suggests an opportunity for special pricing on bulk purchases to encourage upselling.
December accounted for 77% of in-store sales, showing a strong opportunity for seasonal promotions. Shopping timing varied — females preferred Sundays and Mondays, while males leaned towards Thursdays for gift buying.
Two tabs answer the six questions. Slide between them — or tap either dashboard to zoom in.
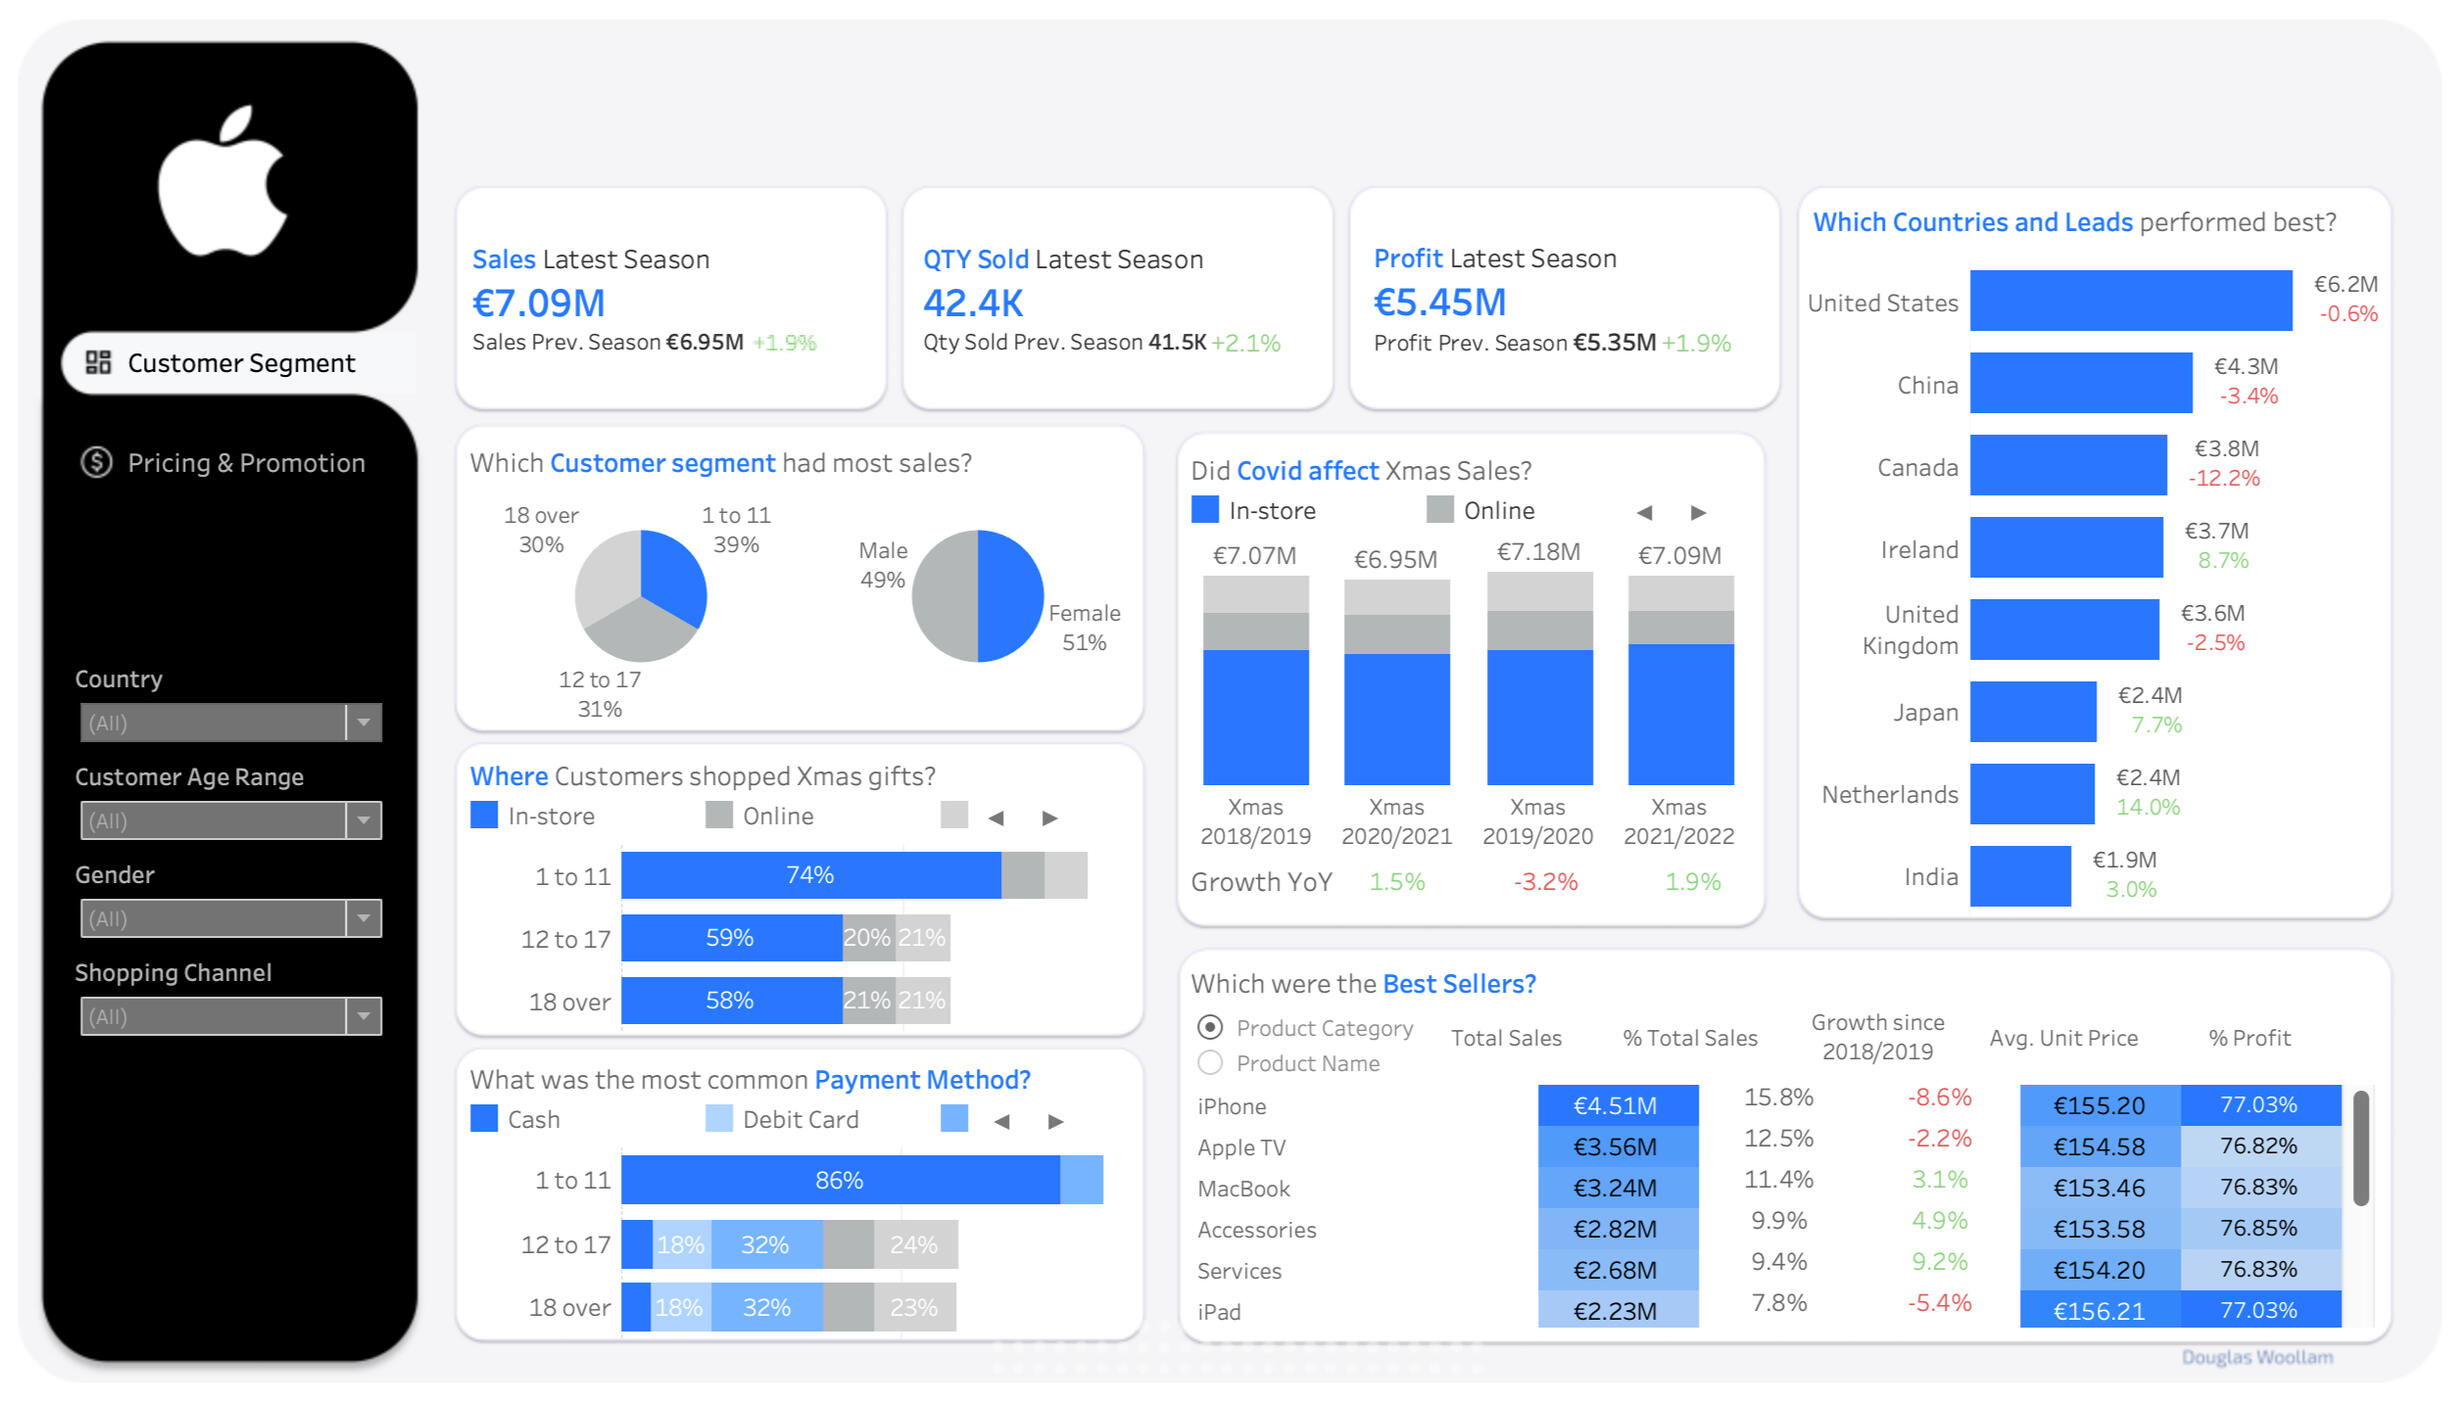
This tab helped answer the questions on Customer Segments, Best Performing Products, Geography, and Covid. It revealed that Children (ages 1–11) contributed nearly 40% of sales, highlighted the decline of top-performing products, mapped regional performance, and showed how sales dipped during the pandemic.
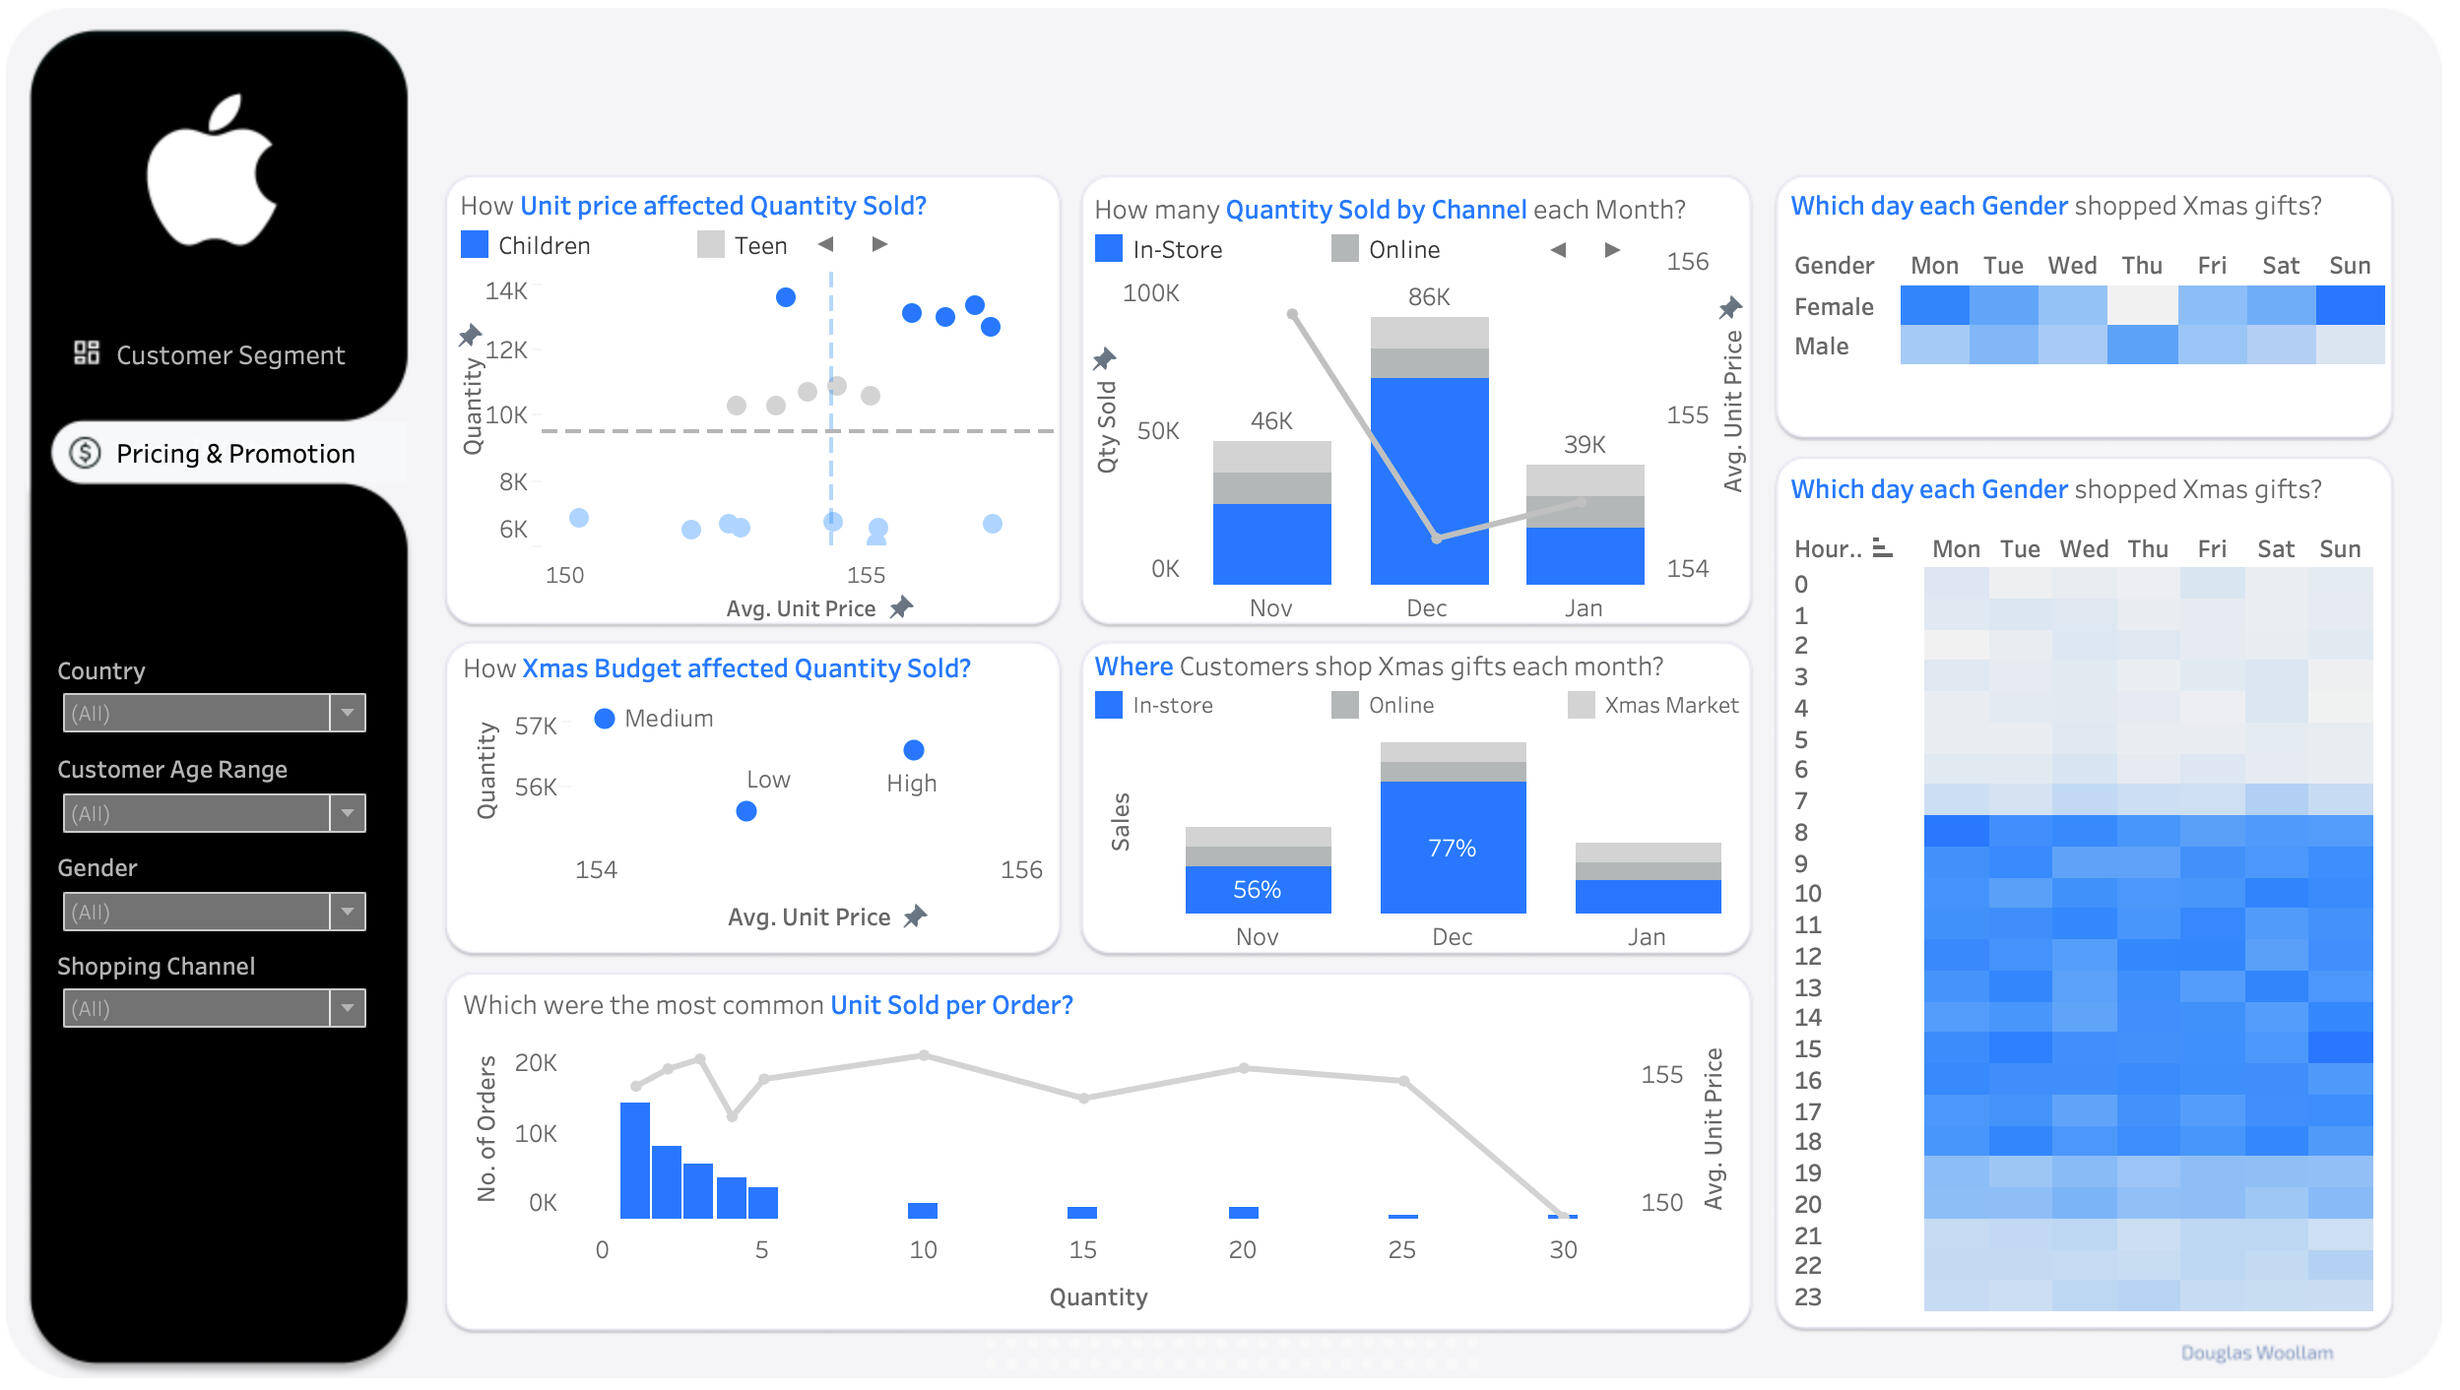
This tab helped answer the questions on Pricing and Shopping Timing. It analyzed how price variation affected sales, identified bulk promotion opportunities, and pinpointed December's 77% in-store sales share as the key window for promotions.
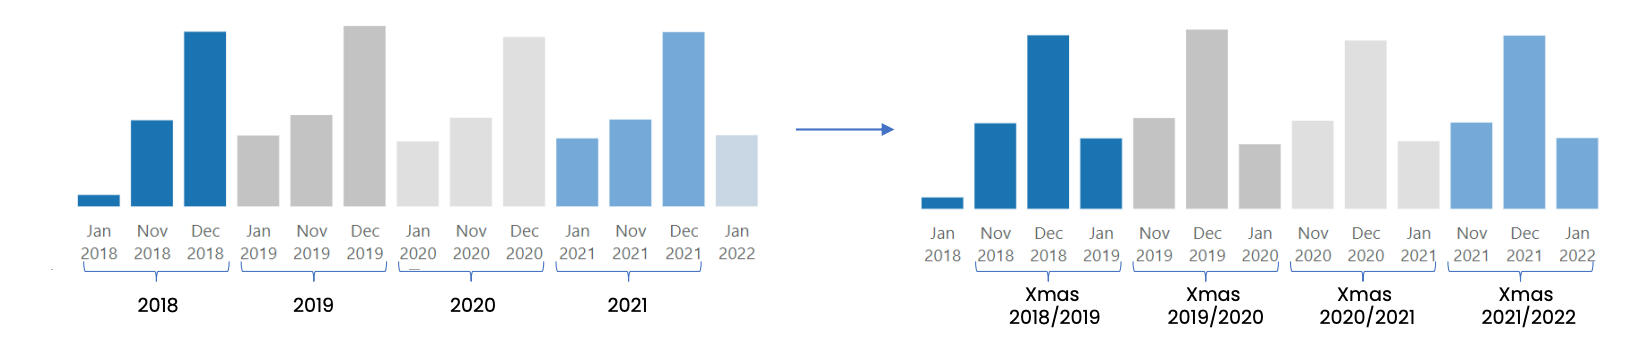
Instead of looking at the data by calendar year, data was grouped into Christmas Seasons to get a better understanding. For example, November 2018, December 2018, and January 2019 are combined into Xmas 2018/2019, considering these three months as one season for retailers and shoppers alike.
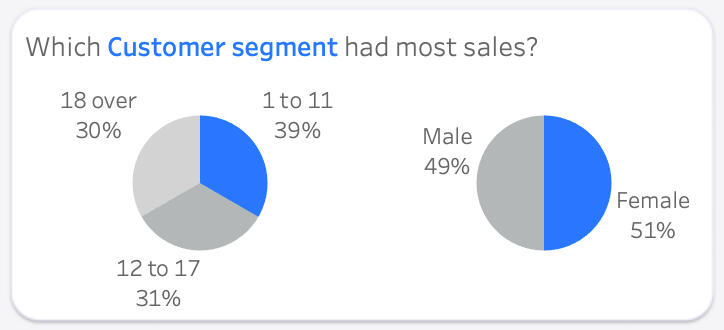
The Children segment (ages 1-11) stood out, contributing nearly 40% of total Christmas sales over the years. Interestingly, there was no significant difference between male and female customers across different age groups.
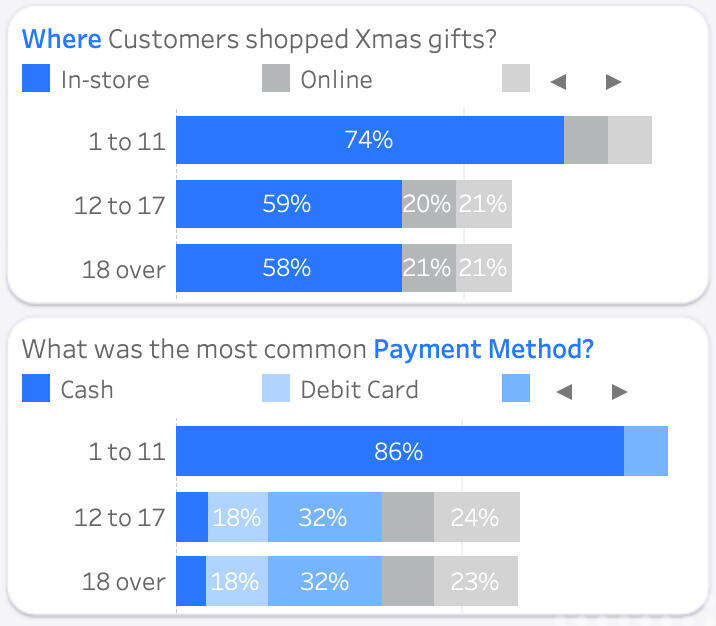
In-store shopping, particularly for the Children segment (74% in stores), was a prevalent choice. This is understandable as kids often prefer the hands-on experience of selecting gifts. Cash was the preferred payment method for Kid purchases, while Teens (ages 12–17) and Adults (ages 18 and over) leaned towards credit card, and cash was their least preferred payment method.
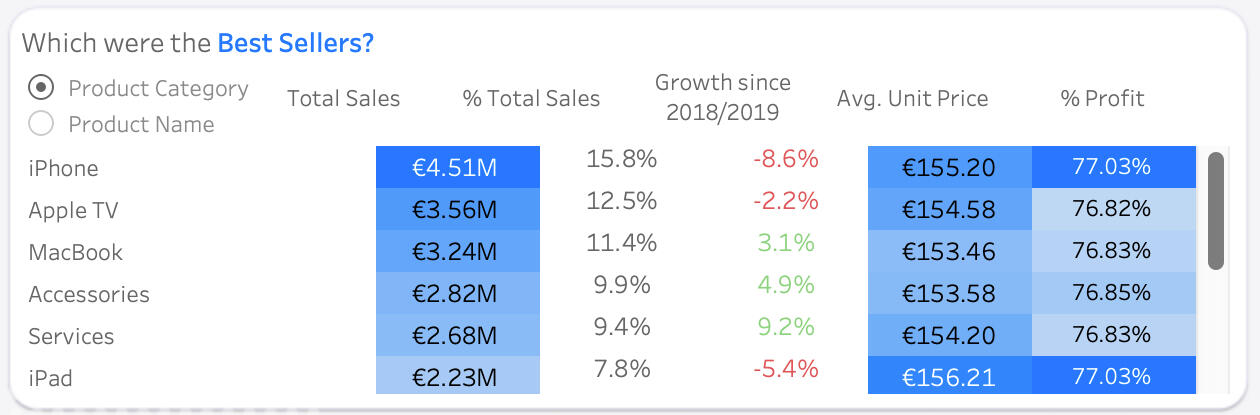
Overall, iPhone and Apple TV took the lead as the top-selling product categories, contributing a significant 27% to total sales among the 11 categories. While iPhone stole the spotlight as the most beloved and profitable category with a staggering 77.03%, it's important to note that its sales had seen a notable decline in the past couple of years.
Breaking it down to the product level, Iphone 13 and Iphone SE were the best sellers, each making up 7.9% to the overall sales. Interestingly, the top 5 performers were all targeted at the Children segment. However, despite their initial popularity, all of these products saw a decline in sales, ranging from -2% to -15% over the past four seasons. Zooming in on the Teenager segment, HomePod Mini emerged as the most cherished Christmas gifts. Meanwhile, in the world of Adults, the Apple Watch Series 5 stole the show, contributing the most to sales and enjoying a substantial sales growth of nearly 50% since the Christmas season of 2018/2019.
United States took the crown for the most Christmas sales over the four seasons, reaching €6.2 million. Canada, once the best in Xmas 2018/2019, faced a decline of -12% over the four seasons. The Netherlands showcased the most significant growth of 14%, climbing from the 7th to the 5th spot.
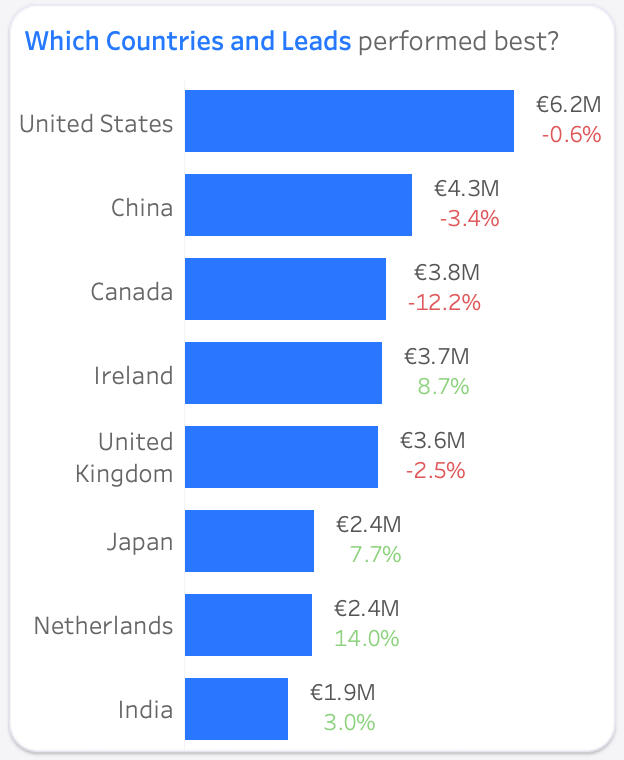
Drilling down to the Sales Leads, the three Stores in United States (Apple Stores, Best Buy USA & MacConnection) emerged as the top-selling Stores, each generating over €1.8 million in sales. In Ireland, Apple Store Ireland & Select (Compu B) emerged as the top-selling Stores, each generating over €0.9 million in sales.
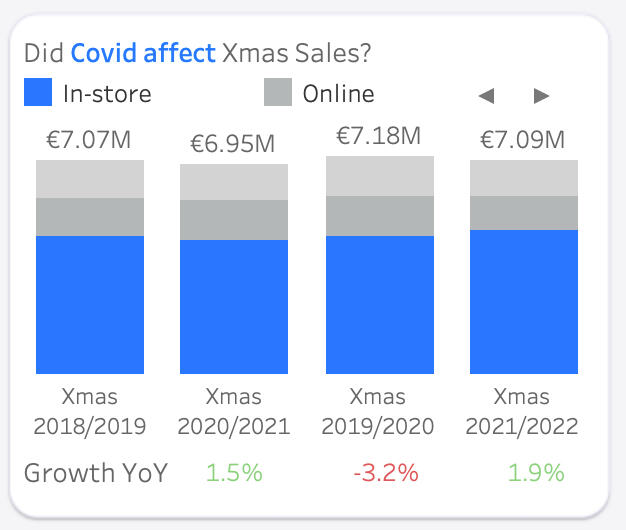
The Christmas gift market felt the impact of Covid in 2020, experiencing a -3.2% sales decrease. A recovery followed in 2021/2022 with a +1.9% increase, but the sales had not yet reached pre-Covid levels.
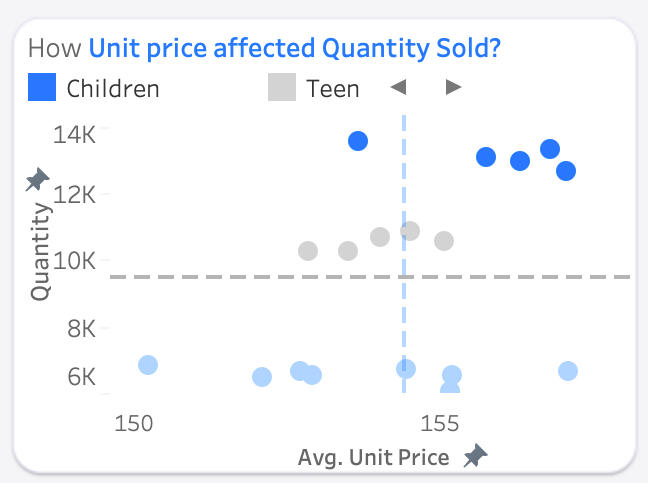
Despite higher prices, children's products lead in sales quantity, with over 12 thousand units sold for each product over the past four Christmas seasons. Among products for adults, unit price variation did not significantly affect the quantity sold (around 6–7 thousand units per product).
Customers tend to buy 1–5 products per transaction, but when making bulk purchases, they preferred 5, 10, 15, or even 30 items. This suggests an opportunity for special pricing on bulk purchases to encourage upselling.
December was the busiest month for Christmas gift shopping, with sales doubling compared to November and January. In-store shopping dominated December, accounting for 77% of sales, making it an excellent time for in-store promotions.
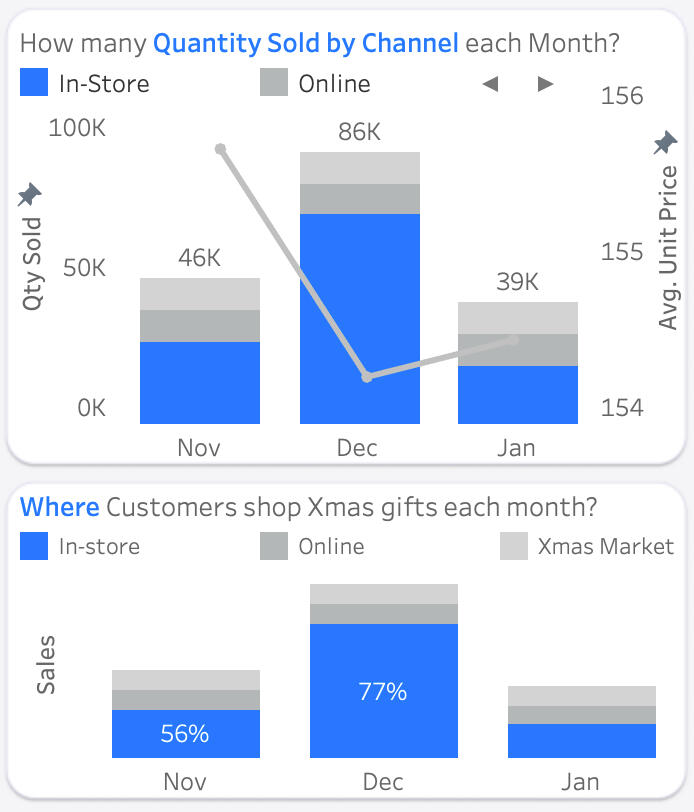
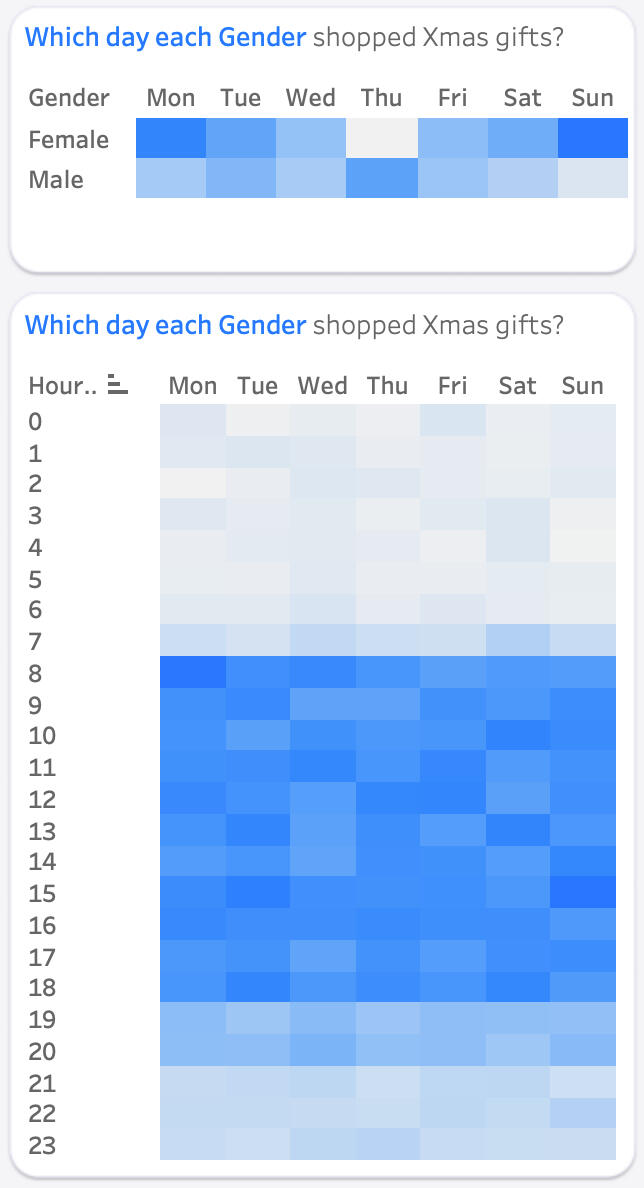
Shopping times varied across different channels. In-store shopping peaked on Monday, followed by Sunday. Sundays at 3 pm became the busiest time for Christmas markets. Online shopping provided flexibility, with peak times at Monday 8 am, Wednesday 11 pm, and Saturday 7 am. Weekday afternoons at 4 pm witnessed the highest online sales. While females preferred Sunday and Monday for Christmas shopping, males leaned towards Thursdays for their festive gift-buying spree.
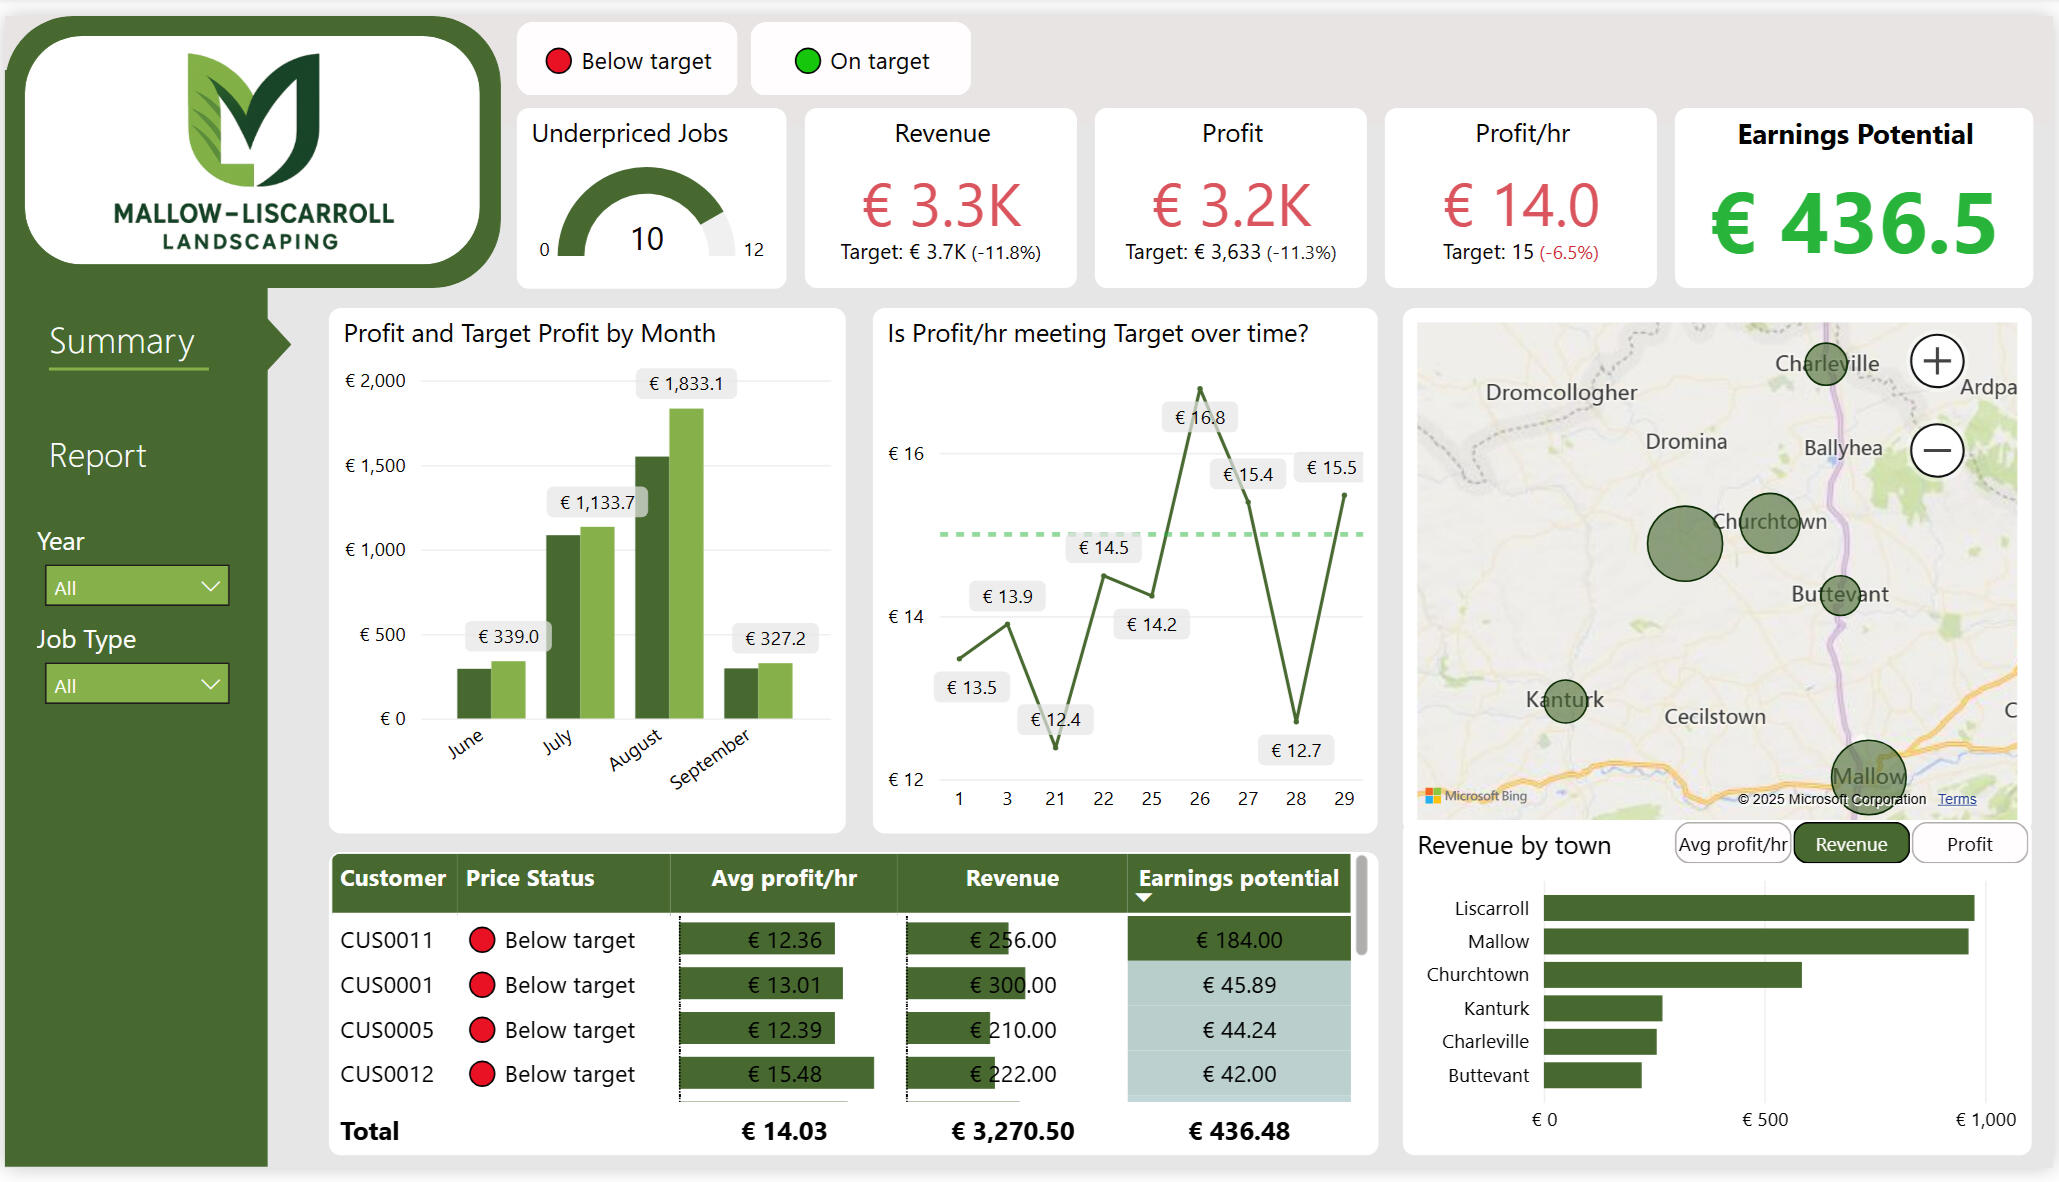
Made for Mallow – Liscarroll Landscaping in my role as a Data Analyst. Recreated with artificial data.
I built the BI stack for a landscaping business I co-founded — an SQL script and Power BI report that replaced manual processes. It increased profit by 20%, identified high-value towns to focus marketing and service checkups on, and saved 1.5 hours of reporting time every week.
Enhanced decision-making with DAX measures that blend distance, fuel price, rental gear and crew size into margin KPIs; visuals let the business slice profit by customer, townland, week or service at will.
Increased gross profit by 20% by developing DAX-based metrics for cost and profitability in a Power BI dashboard, identifying underpriced jobs, and presenting data-backed pricing recommendations to the business owner that included overlooked costs like fuel, distance and differing equipment.
Achieved an 85% repeat booking rate by tracking job frequency in Excel, automating maintenance reminders in Python, and optimising schedules to group nearby clients in Power BI, boosting recurring revenue, client satisfaction, and operational efficiency.
Enabled prioritisation of high-margin, efficiently scheduled jobs and reduced prep time by developing DAX-based KPIs in Power BI that provided cost breakdowns per job by time, location, proximity, and resource costs, improving decision-making and auto-generating daily equipment lists.
Cut weekly reporting time by 75% from 2 hours to 30 minutes by creating a user-friendly Excel workbook, automating the pipeline to the Power BI dashboard and ensuring smooth adoption with a comprehensive user guide and video walkthrough.
A single pipeline moves the data from a spreadsheet all the way through to an interactive report.
My Python code converted individual Excel pages into individual CSV files, ready to import into the Postgres SQL server.
# execute py file in jupyter_venv
from pathlib import Path
import pandas as pd

# path to the workbook
wb = Path('Mallow - Liscarroll Landscaping/landscaping_schema.xlsx')

# check the file exists before proceeding
if not wb.exists():
    raise FileNotFoundError(wb)

# iterate through every sheet
for sheet in pd.ExcelFile(wb).sheet_names:
    df = pd.read_excel(wb, sheet_name=sheet, engine="openpyxl")
    csv_path = wb.parent / f"{sheet.lower()}.csv"
    df.to_csv(csv_path, index=False)
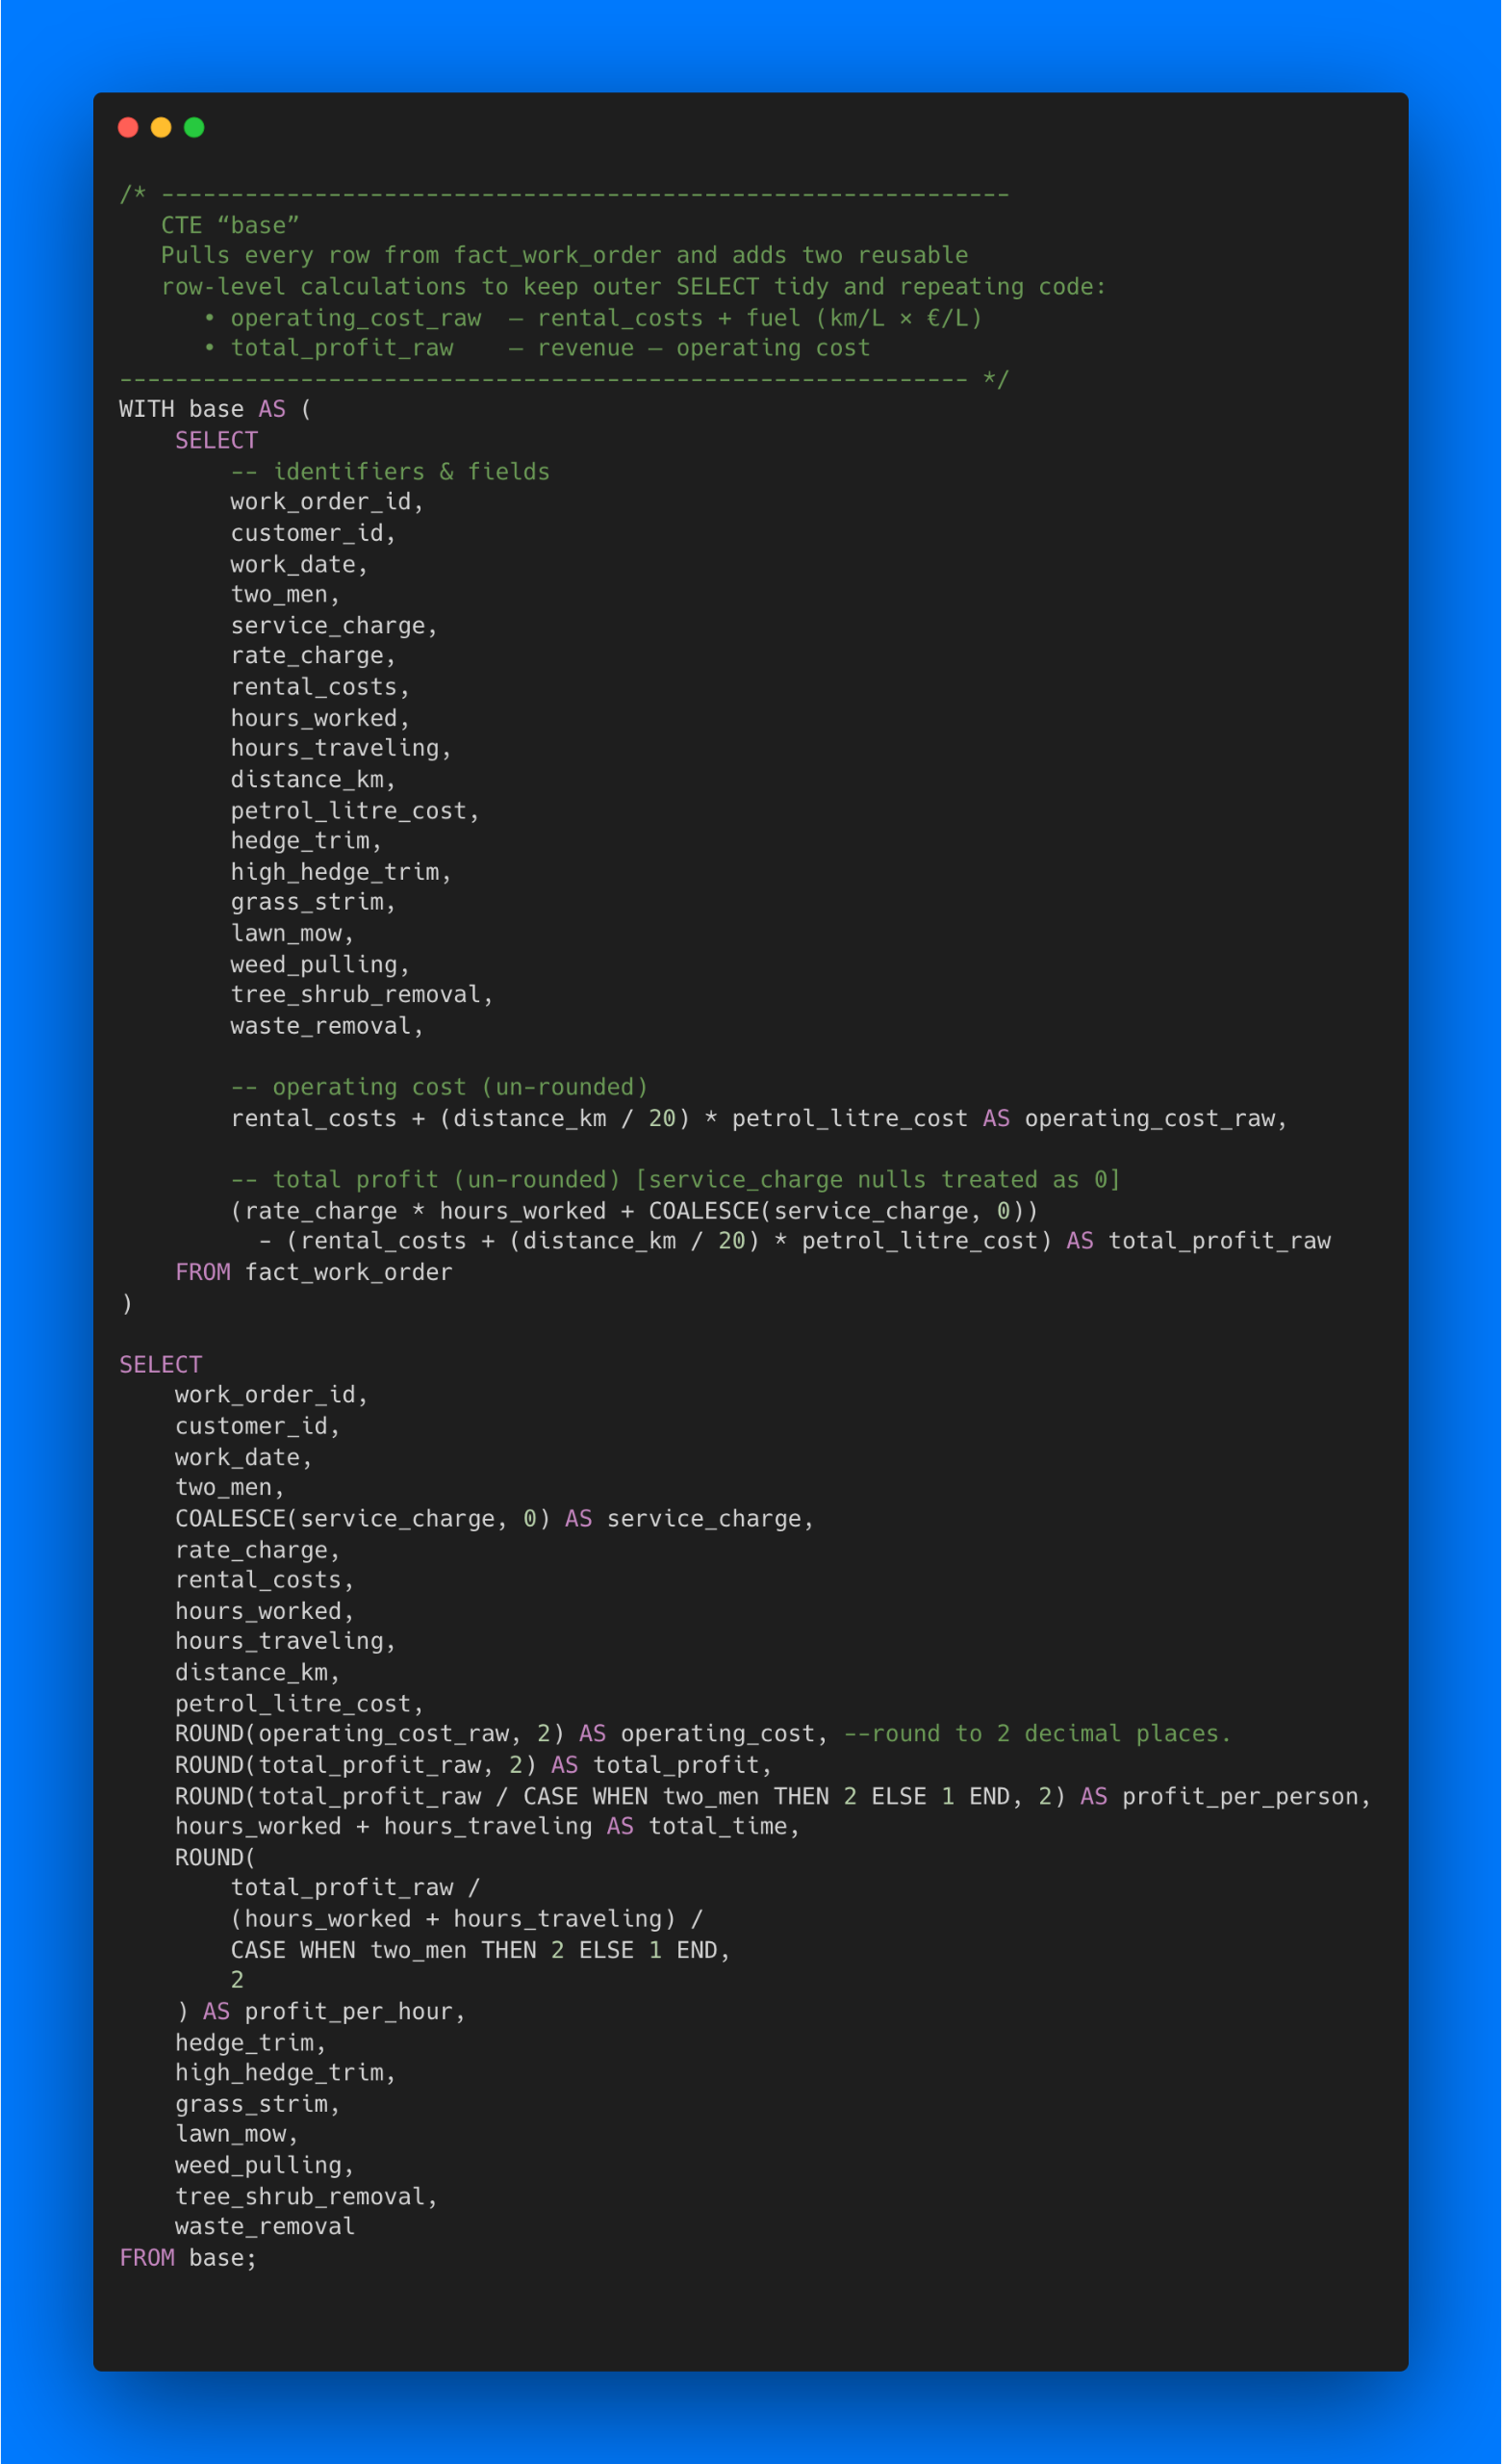
print("Exported", csv_path)170-line SQL script used to build tables from the CSV files. Defines keys and data types, NULL / empty value handling. CTE for dashboard metrics.
Below is the base CTE on fact_work_order, normalises service_charge nulls to 0, rounds to two decimals, and outputs dashboard metrics: operating_cost, total_profit, profit_per_person, total_time, and profit_per_hour
Two tabs make up the report. Slide between them — or tap either dashboard to zoom in.
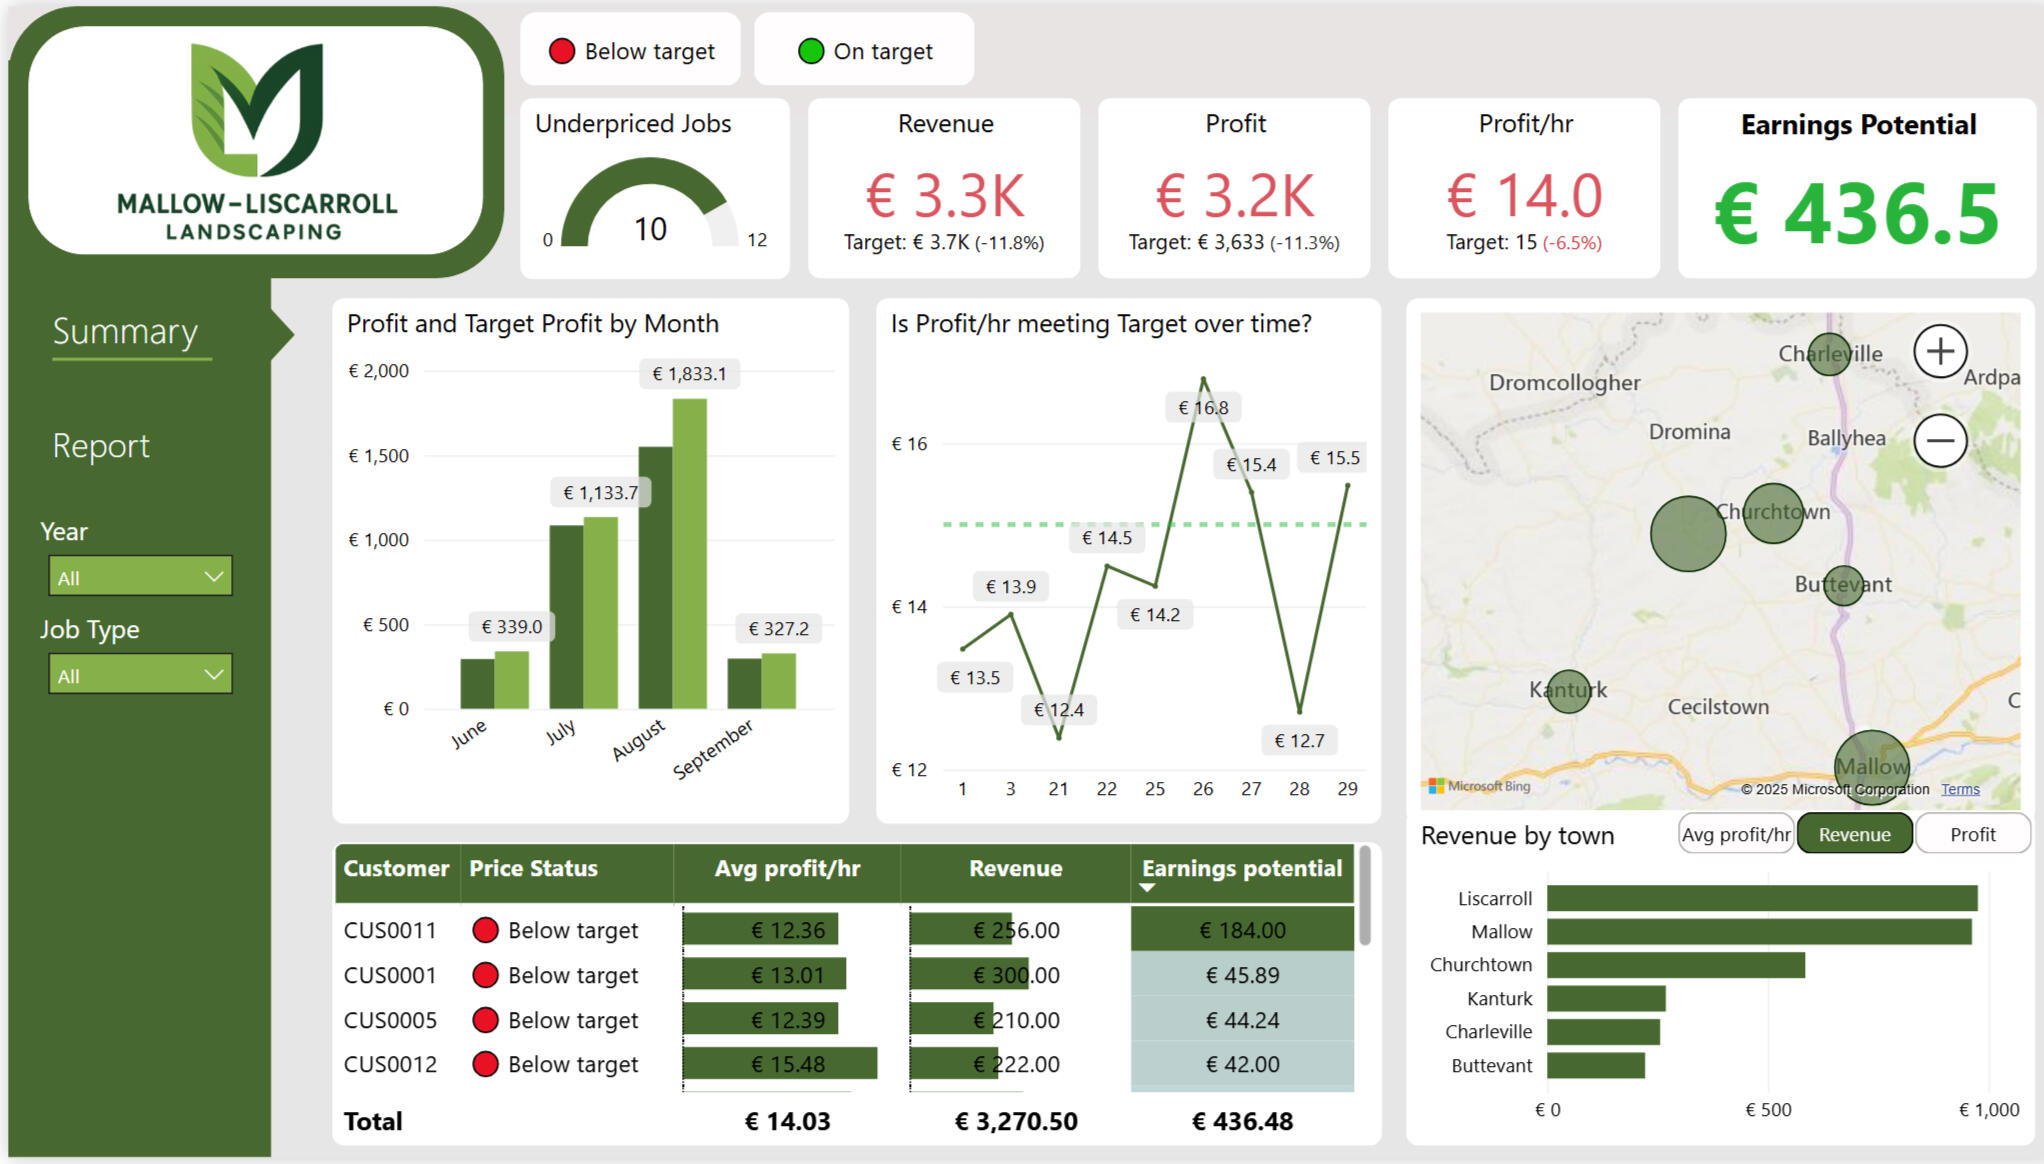
Includes slicers for below / on-target jobs, year and job type. The map and revenue-by-town bar chart use a field parameter to toggle between revenue, profit or profit/hr for flagging high-value towns. The column and line charts can be drilled up or down for time-series analysis.
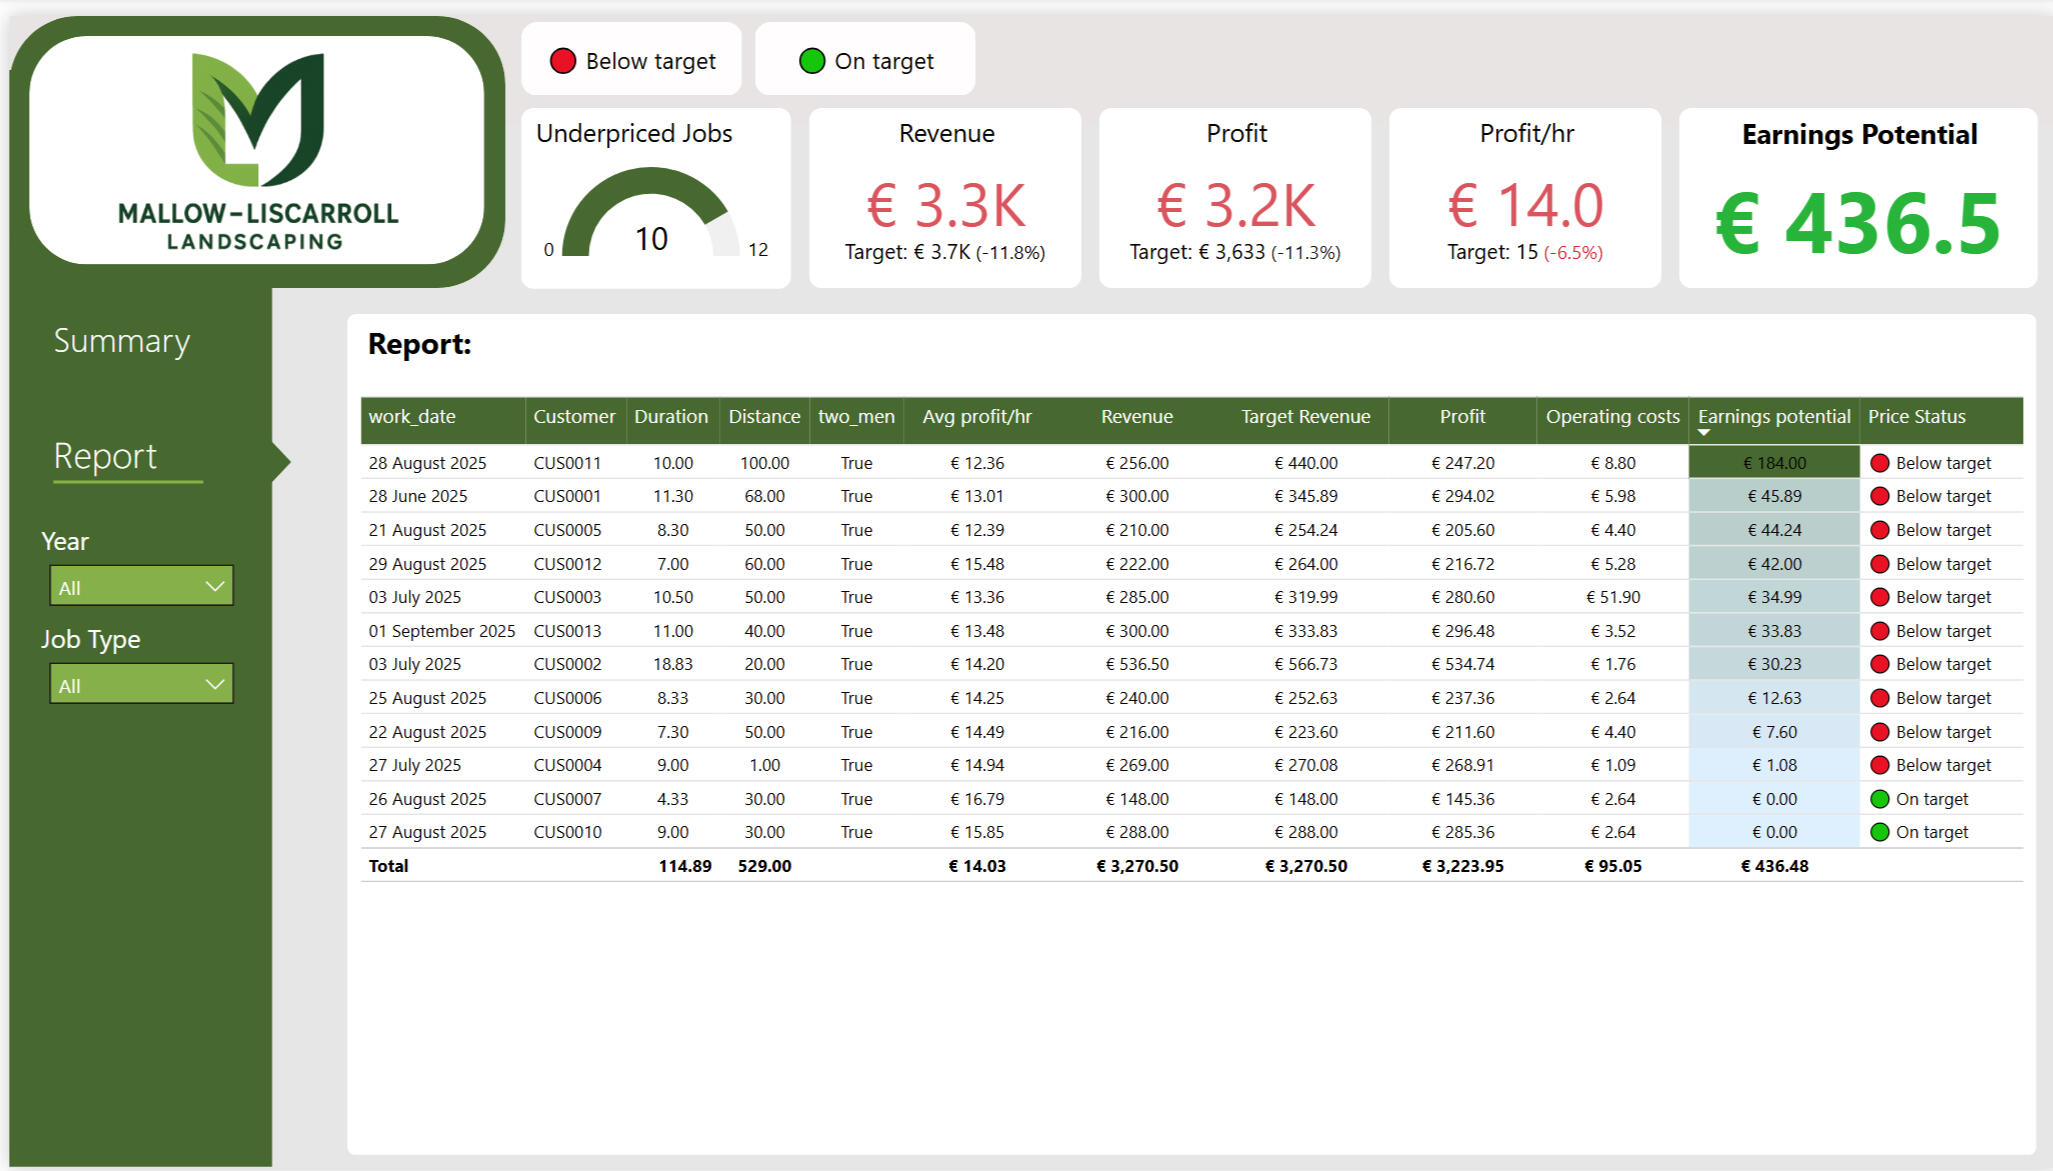
Presents a job-level table with key metrics: work date, customer, duration, distance, crew size, revenue, profit, profit per hour, operating costs, target revenue, earnings potential and price status. All slicers are synced with the summary page.
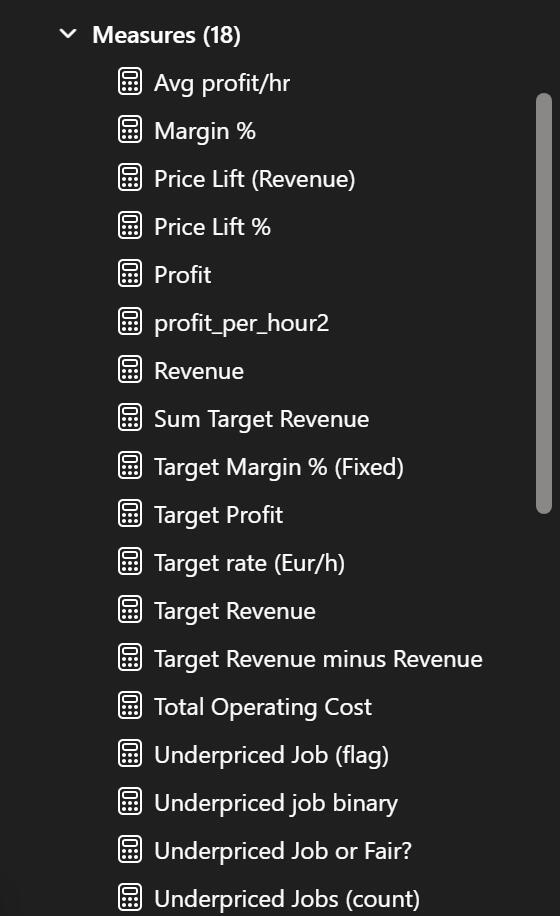
18 DAX measures were created across both tabs of the dashboard. Here are three of the core ones.
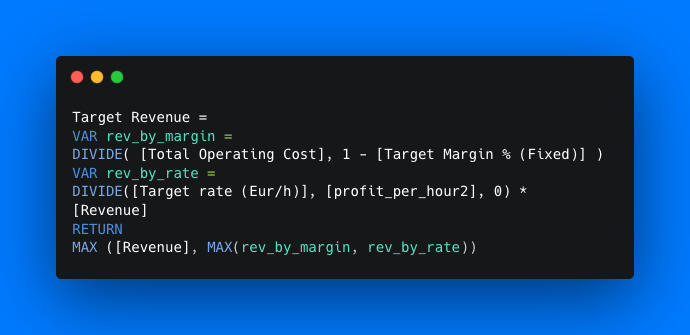
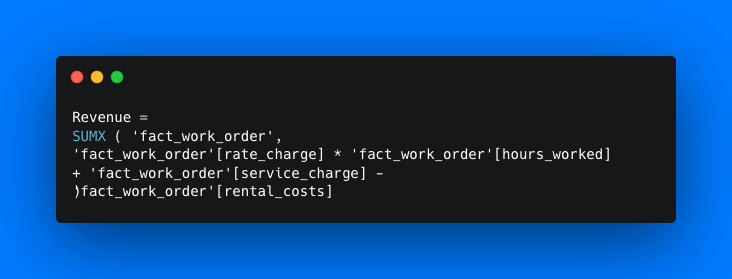
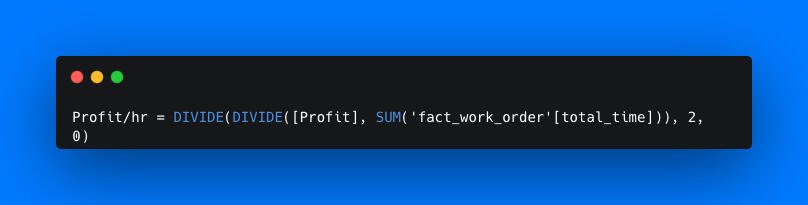
Overall, this project demonstrates how a data pipeline built with Microsoft Excel → Python → SQL → Power BI can transform raw operational data into actionable insights that increase profit, identify high-value clients, and support smarter business decisions.